
The Running Back Cliff: What 388 Drafted RBs Reveal About Talent, Volume, and Why the NFL Stopped Paying Them
A data deep dive that you're going to want to read...that will change the way you see Running Backs
LAB REPORTS

This started as a small question and turned into something much bigger.
A few weeks ago I looked at a narrow stat: since 2015, fifth-round running backs had hit top-12 fantasy seasons at a higher rate than fourth-round backs, in every scoring format. It was a fun, counterintuitive nugget. But when I tried to explain why it was true, the explanation kept slipping. So I did the thing that turns a nugget into an investigation: I pulled every running back drafted since 2008, all 388 of them, and started testing what draft capital actually predicts at the position.
What came back reshaped how I think about it. The Round 4 versus Round 5 gap that sparked all of this turned out to be a small-sample mirage (and yes, that means the stat that started it did not hold up). But that was only the matchstick. Underneath it sat a far more durable structure: Draft capital does not slope, it cliffs, and it does so twice. The backs who get a real chance are stunningly equal no matter when they were drafted. And there is exactly one skill that still separates them, which happens to explain, in my opinion, a large part of why the entire NFL has stopped paying most running backs premium contracts.
This runs in four acts:
Act One: The real shape of running back draft capital.
Act Two: The backs who get a chance produce almost identically in rushing efficiency, regardless of round, but have a wider range of outcomes.
Act Three: The one thing that still separates them, receiving efficiency.
Act Four: So who should you actually chase late?
Every number comes from two data sets, all 388 running backs drafted from 2008 through 2025, pulled with nflfastR and cfbfastR.
Act One: The Cliff
The Stat That Started it All
The original claim came from the 2015 to 2025 draft classes. Among running backs drafted in those years, the share that posted at least one top-12 fantasy season is shown in Table 1. Round 5 doubled or tripled Round 4 in every format.
|
Scoring format |
Round 4 |
Round 5 |
Round 5 edge |
|
Standard |
4.2% |
13.5% |
3.2x |
|
Half PPR |
6.2% |
13.5% |
2.2x |
|
Full PPR |
8.3% |
13.5% |
1.6x |
Table 1. Share of drafted RBs with at least one top-12 fantasy season, 2015-2025 classes (the original claim).
The obvious next question is why? Are fifth-round backs more explosive, or less polished and therefore more developable, or is there something about that slot that selects for upside?
The First Crack
Before chasing a mechanism, the responsible move is to ask whether the gap is even real. In the 2015 window, the full PPR version was 4 hits out of 48 fourth-round backs against 5 hits out of 37 fifth-round backs. Those are tiny counts. A Fisher's exact test returns p = 0.49. (A p-value is the probability of seeing a gap at least this large by chance alone if the two groups were truly identical. Therefore a p-value of 0.49 means a gap this size would show up about half the time from luck, so it tells us nothing reliable.) If a single one of those five backs had finished one spot lower, the edge would have shrunk by a third. That is a warning sign, not a verdict, so I widened the sample to every draft class back to 2008.
Widening to 2008 Kills the Myth
The full sample is all 388 drafted running backs, but the Round 4 versus Round 5 question only concerns those two rounds: 73 fourth-round backs and 56 fifth-round backs. Across that comparison, the idea collapsed. In full PPR, fourth-round backs hit top-12 at 9.6% (7 of 73) and fifth-round backs at 8.9% (5 of 56). Round 4 is now slightly ahead. Fisher's exact returns p = 1.0 and an odds ratio of 0.92. (An odds ratio compares two groups' odds of hitting: 1.0 means no difference, above 1.0 favors the first group, below 1.0 favors the second. Therefore an odds ratio of 0.92 means Round 4's odds were about 8 percent lower than Round 5's, a trivial difference essentially indistinguishable from no gap.) Switch to standard scoring and the edge flips back to Round 5 (10.7% versus 6.8%), but at p = 0.53 that is noise too. When you can make either round look better just by choosing the scoring format, neither round is really better. Table 2 lays out all three formats.
|
Scoring |
Round 4 |
Round 5 |
Verdict |
|
Full PPR |
9.6% (7/73) |
8.9% (5/56) |
Dead even (p = 1.0) |
|
Half PPR |
8.2% |
8.9% |
Tied |
|
Standard |
6.8% |
10.7% |
Leans Rd 5, p = 0.53 (noise) |
Table 2. Round 4 vs Round 5 top-12 hit rate by scoring format, full 2008-2025 sample.
The ceiling story does not hold either. The single best fantasy season in the entire pool of Day 3 backs belongs to a fourth-round pick: Devonta Freeman finished as the overall RB1 in 2015. Round 5's best is Aaron Jones at RB2. Both rounds produced a top-2 overall back. Round 4 is not the lower-ceiling round. The 2015 to 2025 gap was a narrow window doing the work, not the round.
The Real Structure: Two Cliffs
Widening the sample did more than kill one comparison. It revealed the actual shape of running back draft capital, and the shape is the whole story. Table 3 shows the cumulative hit rate by round across all seven rounds, in three importance tiers: RB1 (a top-12 season), RB2 (top-24), and RB3 (top-36), and Chart 1 plots it.
|
Round |
RBs drafted |
RB1 (top-12) |
RB2 (top-24) |
RB3 (top-36) |
|
Round 1 |
31 |
67.7% |
83.9% |
93.5% |
|
Round 2 |
44 |
34.1% |
63.6% |
77.3% |
|
Round 3 |
47 |
25.5% |
48.9% |
68.1% |
|
Round 4 |
73 |
9.6% |
20.5% |
35.6% |
|
Round 5 |
56 |
8.9% |
19.6% |
30.4% |
|
Round 6 |
70 |
2.9% |
8.6% |
10.0% |
|
Round 7 |
67 |
3.0% |
6.0% |
10.4% |
Table 3. Cumulative hit rate by draft round and importance tier, 2008-2025 (PPR).
Read down any column and the same picture appears. A steep drop after Round 3. A flat step from Round 4 to Round 5. Another steep drop after Round 5. A flat floor across Rounds 6 and 7. Draft capital does not slope down evenly. It falls off two cliffs, with plateaus in between.
Chart 1. Cumulative top-12 / top-24 / top-36 hit rate by NFL draft round, 2008-2025 (PPR).
The grouped numbers are emphatic. Day 2 backs (Rounds 2 and 3) reach an RB1 season (top-12) at 29.7%, Day 3 backs (Rounds 4 through 7) at just 6.0%, a gap with p = 0.000000031. (Recall a smaller p-value means a result is less likely to be merely due to chance. Therefore this insanely small p-value means a gap this large would essentially never happen by luck, so the Day 2 versus Day 3 difference is about as certain as you can get.) At the top-24 tier it is 56.0% versus 13.5%, and at top-36 it is 72.5% versus 21.4%, both even more extreme. A formal trend test across all seven rounds returns a vanishingly small p-value (not due to chance). The decline with draft capital is overwhelming. It simply is not a straight line.
However within each tier, the round barely matters for ceiling. Round 2 versus Round 3 is statistically flat. Rounds 4 through 7 are statistically flat for top-12 outcomes (p = 0.19). That within-tier flatness is exactly why the Round 4 versus Round 5 comparison was always going to be noise. They sit on the same plateau.
Floor Versus Ceiling
There is one more layer, and it answers a fair objection. If Day 3 is one flat plateau, why do 64% of fourth-round backs never crack the top 36 while 90% of sixth-round backs never do? That looks like a real difference, and it is. The round to round plateau is flat for ceilings, not for floors. Within Day 3, the chance of producing a league winner (a top-12 season) is statistically identical from Round 4 to Round 7, all between roughly 3% and 10%. But the chance of producing usable depth is not: a Round 4 back reaches at least an RB3 season 35.6% of the time, a Round 6 back just 10.0%, and that difference is significant. A Round 4 or 5 back who misses on league-winning upside often still becomes a useful bench piece. A Round 6 or 7 back who misses usually becomes nothing. Mid Day 3 draft capital buys a better floor, not a better ceiling. Chart 2 shows the full ceiling distribution; Chart 3 isolates the floor.
Chart 2. Career-best fantasy ceiling of every drafted RB by round, 2008-2025 (PPR).
The gold band shows league winners (top-12) while the gray band shows busts (never an RB3 season, meaning never top-36). The gray bust band grows from 6% in Round 1 to 90% by Round 6. The gold league-winner band shrinks similarly in that same span. By the late rounds, a running back pick is overwhelmingly a lottery ticket that amounts to nothing, with a rare and roughly round-independent jackpot.
Chart 3. The floor: share of drafted RBs reaching at least one RB3 season (top-36), by round, with the two cliffs and draft days marked.
Chart 3 is the cleanest picture of the floor. The usable-depth rate holds high through Round 3, falls off the first cliff into Rounds 4 and 5 (around a third still become RB3-or-better), then falls off a second cliff into Rounds 6 and 7, where only one in ten ever returns usable depth. That gap between mid and late Day 3 is the floor difference that matters when you spend a speculative pick.
Act Two: The Equality
So the draft sorts running backs into tiers, hard. The natural assumption is that this is a talent sort: early backs are simply better players. Act Two is where that assumption breaks, because once a back actually gets the ball, the round he came from stops predicting almost anything.
First, The Opportunity Funnel
Start with the simplest question: who even gets a chance? Measured across all drafted backs (no survivorship filter yet), the funnel collapses by draft day, as Table 4 and Chart 4 show.
|
Career milestone |
Round 1 |
Day 2 (Rd 2-3) |
Day 3 (Rd 4-7) |
|
Reached 50+ carries |
100% |
92.3% |
52.6% |
|
Reached 200+ carries |
93.5% |
76.9% |
28.6% |
|
Reached 400+ carries |
83.9% |
61.5% |
13.2% |
|
Median career touches |
1,065 |
607 |
74 |
Table 4. Share of drafted RBs reaching each career-carry milestone, by draft day.
A first-round back is a near-certainty to get fed: 100% reach 50 carries, 93.5% reach 200, and the median first-rounder logs 1,065 career touches. A Day 3 back is the opposite: only 52.6% ever reach 50 carries, just 28.6% reach 200, and the median Day 3 back finishes with 74 career touches, a few games of work. Half of all Day 3 backs never get even a cup of coffee.
Chart 4. Share of drafted RBs reaching each career-carry threshold, by draft day, 2008-2025.
Now the Stat That Stopped Me Cold
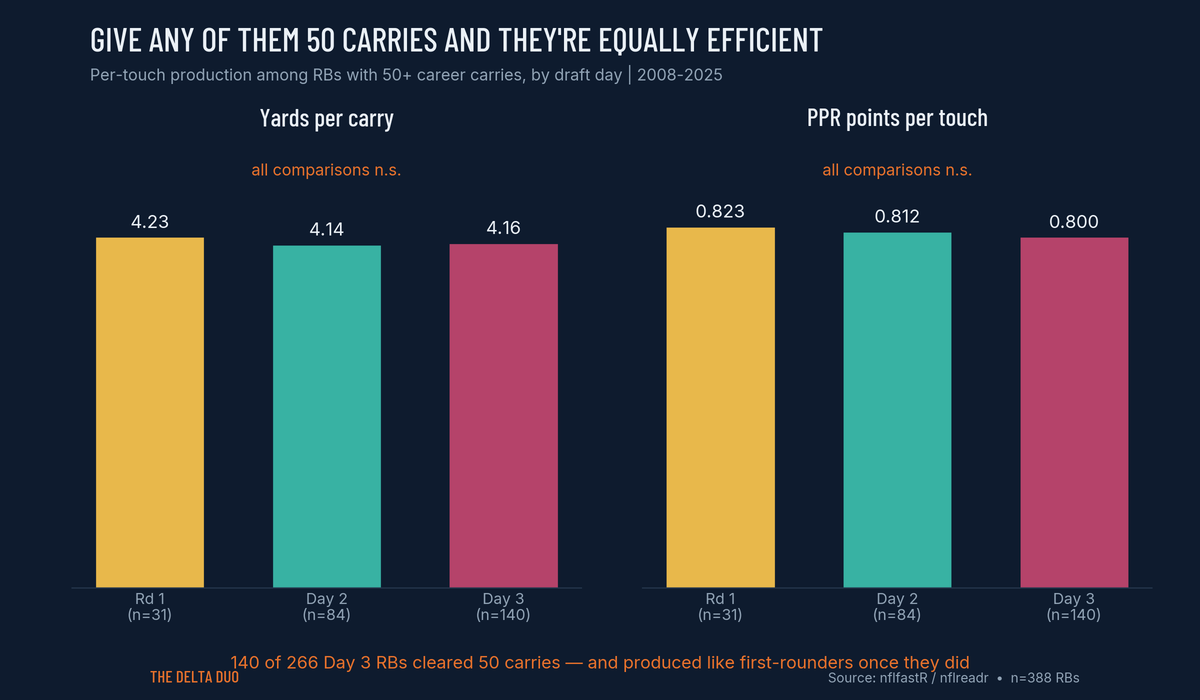
Take only the backs who cleared a real audition, 50 or more career carries, and compare how good they were with the ball. This is my favorite number in the entire study, because it is so counterintuitive. Table 5 and Chart 5 tell it.
|
Among RBs with 50+ carries |
Round 1 (n=31) |
Day 2 (n=84) |
Day 3 (n=140) |
|
Yards per carry |
4.23 |
4.14 |
4.16 |
|
Yards per touch |
4.82 |
4.79 |
4.73 |
|
PPR points per touch |
0.823 |
0.812 |
0.800 |
|
Touches per game |
16.3 |
11.8 |
7.2 |
Table 5. Per-touch production among RBs with 50+ career carries, by draft day.
The averages are statistically the same. Yards per carry: 4.23, 4.14, 4.16. PPR points per touch: 0.823, 0.812, 0.800. Yards per touch: 4.82, 4.79, 4.73. Not one of these comparisons is statistically significant (every Holm-adjusted p between 0.44 and 1.0). A Day 3 back who earns 50 carries, on average, does exactly as much with each touch as a first-round back. The only thing that separates them is the last row: volume. First-rounders get 16.3 touches per game, Day 3 backs 7.2. Same efficiency, less than half the workload.
Chart 5. Per-touch production among RBs with 50+ career carries, by draft day, 2008-2025.
Sit with the supply implication for a second. 140 of the 266 Day 3 backs in this study cleared 50 carries, and as a group they ran the ball as efficiently as first-round picks. That is not a handful of late-round unicorns. That is more than half of a draft's worth of cheap backs producing like premium ones once handed the ball. Put differently: take two random Day 3 running backs, and there are decent odds at least one of them, given a real workload, would be as efficient a rusher as a first-rounder. The supply of functional NFL running backs is deep, and it sits in the rounds nobody pays for.
What the Averages Don’t Tell Us
Averages can agree, and they do, while the underlying distributions show a little more detail. Chart 6 does that with box plots: the box is the middle half of backs, the line is the median, the whiskers are the range, and the dots are outliers.
The centers confirm Act Two. Among backs with 50+ carries, the median yards per carry (center p = 0.31), points per touch (center p = 0.83), and explosive-run rate (center p = 0.12) are statistically indistinguishable across draft days. The typical back who earns a role produces the same regardless of when he was drafted.
Chart 6. Distribution of per-touch efficiency by draft day, among RBs who earned a real role, 2008-2025. Box plots show the full range, not just the average.
The spread tells a second story the averages could not. As draft capital drops, the distributions widen. Points per touch spreads significantly (spread p = 0.05), as does explosive-run rate (spread p = 0.02). A Day 3 back who earns carries has the same median efficiency as a first-rounder, but a wider range of outcomes around it: more of the genuine busts, and a few of the biggest hits, live on Day 3, while first-rounders cluster more tightly around the shared center. This is the same lesson as the floor-versus-ceiling finding in Act One, now visible at the level of per-touch play: Draft capital does not buy a higher efficiency ceiling, it buys a narrower, safer range. The median is the same. The risk is not.
But Are They Getting That Efficiency a Different Way?
If the per-touch averages match, maybe the route to production differs. It does not. Among everyone with 50+ carries, the texture metrics are flat too (Chart 7). Explosive-run rate (carries of 10+ yards): 10.5%, 10.2%, 9.8%, not significant. Runs of 15+: 4.7%, 4.4%, 4.2%, not significant. Stuffed-run rate: 19.8%, 18.9%, 18.2%, not significant. The Next Gen Stats charted metrics agree: rushing efficiency (the tracking-based wander stat) 3.96 / 3.91 / 3.87, percent of carries against a stacked box 22.2 / 21.5 / 21.7, and time behind the line before contact 2.79 / 2.79 / 2.75 are all flat. Day 3 backs are not facing easier boxes, not less decisive, not less explosive. When they run, they run like everyone else.
Chart 7. Rushing texture among RBs with 50+ carries, by draft day, 2008-2025. None of the gaps are statistically significant.
One honest caveat that matters here: every efficiency number in this act is conditional on getting carries, and getting carries is itself influenced by draft capital. The 50-carry filter selects on competence, so the Day 3 backs in these tables are the survivors, not all Day 3 backs. The correct reading is not “any drafted back would be this good if fed,” because the funnel already disproves that: half of Day 3 backs never clear 50 carries at all. The reading is narrower and still striking: among the backs good enough to earn a real role (and half of Day 3 backs do), the round they came from no longer predicts their per-touch value. The draft sorts who gets the chance. It does not sort how good they are once they take it. And even at a lower 20-carry bar, the only metric that even flirts with a gap is yards per carry (Round 1 versus Day 3, p = 0.071), and it still does not clear significance.
There is also a subtler point in conversion. Give every group the same 50-carry audition and ask who converts to fantasy relevance: 93.5% of first-rounders reach top-36, versus 78.6% of Day 2 backs and 40.7% of Day 3 backs. So opportunity is not the entire story. But since per-touch efficiency is equal at its average (Act Two's core finding), the gap is not that Day 3 backs are worse with the ball. It is that clearing 50 carries is not the same as being handed the 250-carry bell-cow workload that manufactures RB1 seasons. The efficient late-round back rarely gets promoted to that volume. It is a volume-tier gate, not a talent gate.
Act Three: The One Thing That Separates Them
If late-round backs run just as well, something has to give. People will say it instinctively: some players are simply better, and the data should show it somewhere. It does, in exactly one place, and it is not the part of the game everyone obsesses over. It is receiving. Table 6 and Chart 8 break it down.
|
Among RBs with 20+ targets |
Round 1 |
Day 2 |
Day 3 |
Rd 1 vs Day 3 |
|
Catch rate |
0.757 |
0.767 |
0.755 |
p = 0.37 (n.s.) |
|
Yards per catch |
8.03 |
7.59 |
7.45 |
p = 0.034 |
|
Yards per target |
6.07 |
5.87 |
5.50 |
p = 0.005 |
Table 6. Receiving production among RBs with 20+ career targets, by draft day.
Catch rate is flat: 0.757, 0.767, 0.755 (p = 0.37, not statistically significant). Day 3 backs catch the ball at the same rate. But what they do with it differs. Yards per catch falls from 8.03 (Round 1) to 7.45 (Day 3), p = 0.034, and yards per target falls from 6.07 to 5.50, p = 0.005, the lowest p-value in all of the texture testing. Those p-values indicate that this information is in fact, statistically significant. First-round backs are simply more dangerous with the ball in space in the passing game. They catch it the same, and they gain more after.
Chart 8. Day 3 RBs' per-touch production as a percent of first-round RBs (50+ carries / 20+ targets), 2008-2025. Shown indexed to the Round 1 level (100) so rushing and receiving sit on one comparable scale; bars below 100 mean Day 3 trails first-rounders.
Now, what does the receiving gap actually mean, and how much should it carry? Two separate things are true. First, it is real: statistical significance tells us the gap is not random noise, so we can trust that first-round backs genuinely are better receivers per catch, and it moves consistently across all three tiers (yards per catch 8.03, 7.59, 7.45). Second, it is small: about half a yard per catch, and it is the one metric clearing correction out of nine in this block. So this is a real, repeatable edge, not a chasm. That nuance matters for the big claim. Because this modest receiving edge is the only place draft capital reliably shows up in on-field ability, the honest takeaway is not “first-rounders are far better players.” It is closer to the opposite: among backs who play, on average they are remarkably equal, with one small receiving exception. The separation between early and late backs is mostly about opportunity, not talent. However I do want to note that since these are averages, there are ABSOLUTELY elite running backs, and a majority of those are found in earlier rounds. This is where the ceiling comes in. We have already shown that 1st round running backs have a much higher ceiling than any other round and that absolutely has to do with talent. On average though, these differences described above are much more slight.
The Exception: Derrick Henry
Every rule has its outlier, so let’s look at one, who happens to be one of the best players in the data. Derrick Henry was a second-round pick (45th overall, 2016), and he became one of the most dominant rushers in NFL history with almost no receiving game at all (scouts flagged his below-average hands coming out of Alabama). He is the rare back who built an all-time career on pure rushing volume and tackle-breaking, the exact profile our receiving finding says should not separate. Henry is not a counterexample to the thesis so much as a reminder that individual greatness can override any population trend. He is also, notably, not a Day 3 back, which is the point: the truly special ones tend to get drafted on Day 1 or 2. He is the exception precisely because he is so rare. That does not mean there are no special backs to be found on Day 3, only that a single outlier never erases the broader trend.
Act Four: So Who Should You Actually Chase Late?
Acts One through Three leave us somewhere specific: draft round powerfully predicts opportunity, barely predicts on-field ability, and shows only one small skill gap (receiving efficiency). So if you are throwing a late-round dart, what actually flags a back worth chasing? The data points to one trait above all, and it is the pass game, just not in the way Act Three might suggest... A note on scope first: this section leans on college data, which is only reliable from the 2015 draft class onward, so the college findings here cover 2015-2025 (202 matched backs), while the rest of the study stays 2008-2025.
College Receiving Production is the Signal
Split drafted backs by their college receiving profile (the top third by college receiving yards are “college pass-catchers”) and the NFL outcomes diverge sharply, as Table 7 and Chart 9 show.
|
NFL outcome |
College pass-catcher |
Everyone else |
|
Reached 50+ carries |
75.0% |
62.7% |
|
Reached 200+ carries |
52.9% |
40.3% |
|
Reached RB3 (top-36) |
51.5% |
31.3% |
|
Reached RB1 (top-12) |
32.4% |
9.7% |
Table 7. NFL outcomes of drafted RBs by college receiving profile, 2015-2025 classes (202 matched RBs).
College pass-catchers, regardless of round, reach 50+ carries more often (75.0% vs 62.7%), reach 200+ carries more often (52.9% vs 40.3%), and reach usable RB3 fantasy seasons far more often (51.5% vs 31.3%, p = 0.006, statistically significant). The headline is the league-winner rung: college pass-catchers post a top-12 season 32.4% of the time versus 9.7% for everyone else, more than triple the rate. Among the backs who never even reached 50 carries, only 25.4% were college pass-catchers, versus 37.8% of the backs who did. College receiving production is one of the strongest signals in the entire study that a drafted back will earn a real role and hit.
Chart 9. NFL outcomes of drafted RBs by college receiving profile, 2015-2025 classes.
The Mechanism: Presence on Passing Downs
Why would college receiving matter so much? Because it points to the one thing a late-round back can win that actually converts to production: snaps on passing downs. A receiving skill is how you earn your way onto the field when the offense drops back, and being out there, play after play, is what turns into the touches, targets, and trust that become fantasy points.
And that presence is scarce, handed out almost entirely by draft capital. Chart 10 shows the median share of his NFL team's pass plays a back is on the field for, by draft day: first-rounders 51.2%, Day 2 backs 39.4%, and Day 3 backs just 16.6%. Early picks are essentially installed on passing downs; late picks have to take those snaps from someone. That is the gap a late-round back has to close, and receiving ability is the most reliable tool for closing it.
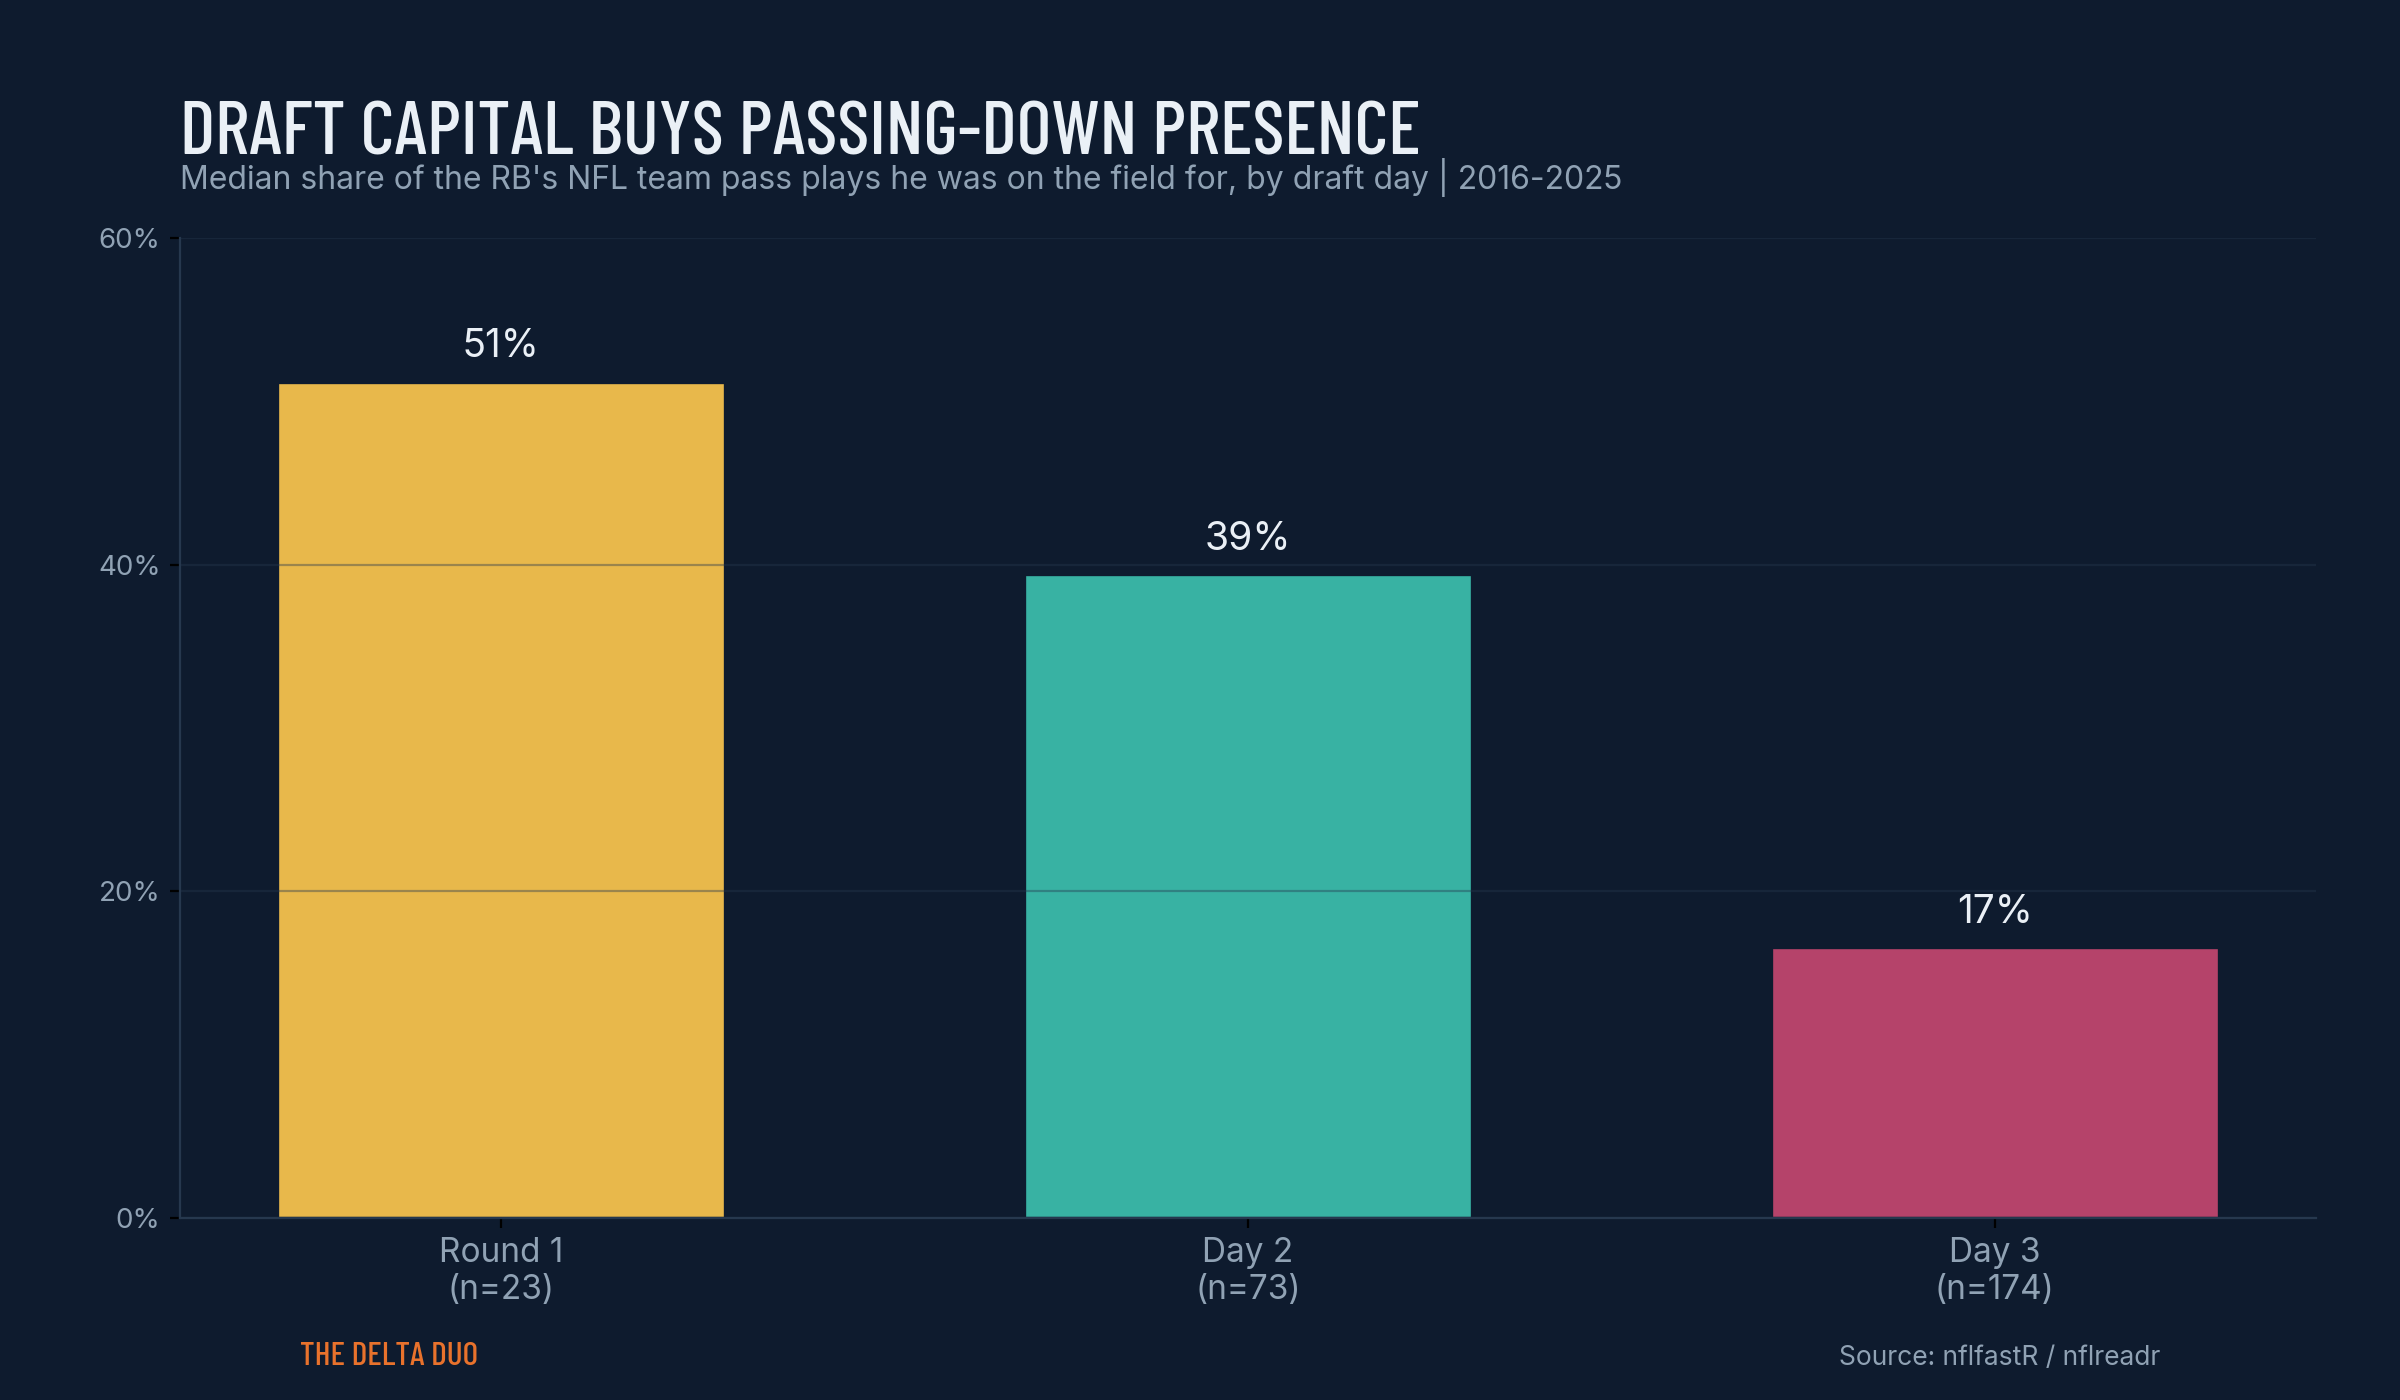
Chart 10. Median share of NFL team pass plays the RB was on the field for, by draft day, 2016-2025.
And presence is the mechanism behind hitting. Chart 11 splits backs by whether they ever reached top-36: the ones who hit were on the field for 41.1% of their team's pass plays, the ones who missed just 9.7%. Being out there on passing downs is the opportunity. Whether a back catches it, blocks, or simply proves to the staff he belongs in ways a box score cannot capture, presence is what converts to production. (One honest caveat: presence on pass plays is partly a consequence of being good, not only a cause, since you have to earn third-down trust. So read this as the clearest channel we can see, not as proof that snaps alone create production.)
Chart 11. Median share of NFL team pass plays on the field: backs who hit top-36 vs those who did not, 2016-2025.
Why a Late-Round Receiving Back is a Better Dart Throw
Act Three found that among backs who get a receiving role, the Day 3 ones are slightly less efficient per catch. However, this Act finds that college pass-catchers are far more likely to get a role and hit. Both are true because they measure different things, and this clarification is the whole takeaway: college receiving predicts getting the job, not being elite at it, and on Day 3 getting the job is the whole ballgame.
Here is the logic, step by step. First, the scarce and valuable thing for any running back is volume, and on Day 3 the most realistic path to volume is the passing-down role. You are not going to beat an early-round pick for early-down bell-cow work. Second, college receiving production is the best predictor we found that a back will actually earn that passing-down role and hit, a 32.4% top-12 rate versus 9.7%. It is an opportunity signal. Third, it is not a promise he will be an efficient NFL receiver: that skill carries over only loosely (the Spearman correlation between college receiving yards and early-career NFL receiving yards per game is just 0.27), and per Act Three he may even be a hair less efficient per catch than an early-rounder. So you are betting on access to a role, not on elite production in it. Fourth, that is still a great late-dart bet, because on Day 3 the binding constraint is simply whether a back ever gets a role at all, and college receiving is the best available answer to that question.
What This Means for How the NFL Pays Running Backs
This section steps beyond fantasy football and into interpretation, so I am labeling it clearly as inference rather than measured fact. But the data points somewhere genuinely interesting about the real-life running back market, and it is too good not to follow.
Running back contracts have shrunk, second contracts have largely vanished, and the position is routinely called the most replaceable in football. The numbers in this study are, in effect, a rational explanation for why. The part of running back play that is replaceable, efficient rushing, is everywhere: a first-round back and a Day 3 back who both earn carries run the ball equally well, and the league can reliably restock that skill cheaply every April (140 of 266 Day 3 backs cleared a real workload and produced like premium picks). The part of running back value that is scarce, bell-cow volume, is not created by the back at all. It is created by the offense and the role, the thing teams assign rather than buy. So a front office paying premium money for a running back is mostly paying for the replaceable part while the valuable part (volume) is something they control for free by handing it to whoever is on the roster.
The one dimension where draft capital still buys something real, receiving value in space, is exactly the dimension the modern market still pays for. The backs who command money now (the three-down pass-catching weapons) are paid for the skill our data says does not replicate cheaply, not for grinding out 4.2 yards a carry, because the grind is available in the fifth round. The market, in other words, looks rational in light of these numbers. It stopped paying for the replaceable thing and kept paying, selectively, for the scarce one.
The Honesty Section: What This Study Cannot Claim
This piece lives and dies on not overstating, so here are the limits, stated plainly.
First and most important, the efficiency and receiving findings are conditional on getting on the field. We can only measure per-touch value for backs who got touches, and touches are partly assigned by draft capital. So this characterizes the backs who earned a role, not the latent talent of every drafted back. It does not mean a random Day 3 back would be as good as a first-rounder if fed. The funnel is explicit that only about half of Day 3 backs clear even 50 carries. The honest framing throughout is that among the backs who earn a real role, draft capital does not determine rushing efficiency.
Second, fantasy finish bundles talent, opportunity, and landing spot. Draft capital partly causes opportunity, since teams feed early picks. So the cliff reflects both that earlier backs are better prospects and that earlier backs get more volume. Both are true at once.
Third, the receiving gap is modest (about half a yard per catch) and is one metric clearing correction out of nine in that block. It is real and directionally consistent, but it is an edge, not a canyon. The college-receiving findings in Act Four are likewise associational and conditioned on reaching the NFL, so they show receiving ability is linked to earning opportunity, not that it mechanically causes it.
Fourth, this covers drafted running backs only. The undrafted hits of the era (Austin Ekeler, James Robinson, Raheem Mostert) are not in these counts. Top-12, 24, and 36 are within-season positional ranks, so they self-adjust for scoring inflation, but the type of back that hits has drifted toward pass-catching as PPR has spread. Every headline number is full PPR; however standard and half PPR show the same two-cliff structure.
Finally, one metric was tested and deliberately left out: rushing yards over expected, a tracking stat that estimates how many yards a back gains above what an average runner would on the same carries. We ran it twice with slightly different filters and got meaningfully different answers each time, which means the result was not stable. When a number swings depending on small analysis choices, the honest move is to leave it out rather than pick the version that fits the story. So it is not in any of our conclusions.
What It Means for Your Fantasy Draft
The practical takeaways are clean. If you want a league winner at running back, you pay for it at the top of the draft. Day 2 backs reach top-12 at nearly 30%, Day 3 backs at 6%. There is no late-round shortcut to RB1 odds.
Once you are on Day 3, the round on the card has essentially stopped telling you about upside. A fourth-round rookie and a seventh-round rookie carry close to the same league-winner odds. So stop drafting the round and start drafting the situation: projected role, path to touches, offensive quality, and pass-game usage are what is left to separate them, because the per-touch ability is roughly equal across the board.
If you are speculating late, know what you are buying. If you want a shot at a ceiling guy, a RB1 finish, Rounds 4-7 mean exactly the same thing. Take the shot on who you think has the best chance at earning opportunities and becoming elite, a player you truly have conviction on. If you are looking for a floor, a reliable flex player that eclipses a RB3 season from time to time, Rounds 4 and 5 have slightly better odds.
Lastly, there is one trait that should move a late back up your board: college receiving production. It is the strongest signal we found that a late pick will earn passing-down snaps and reach fantasy relevance (college pass-catchers hit top-12 at 32.4% versus 9.7%). Take a back like Eli Heidenreich, the Round 7 pick out of Navy who led his team in receiving yards despite playing running back. His profile is exactly the one our data flags as worth a late swing, not because the numbers promise he will be a star, but because that receiving profile puts him in the group far more likely to earn a role and return value. The honest caveat from Act Three still holds: a late receiving back tends to be a slightly less efficient receiver per catch than an early one, so the bet is on him earning opportunity, not on him being necessarily elite per touch. For a final-round flier, “more likely to earn a role and hit” is exactly the bet you want.
Methodology
Data from nflfastR and nflreadr, with college receiving data from cfbfastR (CFBD). Population: all 388 running backs drafted from 2008 through 2025 (2 lacked a matchable player ID and were dropped from joins). For each player, fantasy points were summed by season (regular season only) and ranked within position each year, in standard, half PPR, and full PPR. A hit at a given tier means the player reached that positional rank (top-12, 24, or 36) in at least one season. Per-touch efficiency, big-play rates, and receiving metrics were computed on backs clearing minimum-volume bars (50+ carries, 20+ targets) to avoid tiny-sample noise, with the explicit caveat that this conditions on opportunity. The college analysis covers the 2015-2025 draft classes (202 matched backs, joined by normalized name and final college season) and the snap-participation analysis covers 2016-2025. Hit rates were compared with Fisher's exact tests, within-tier distributions with chi-square tests, the round trend with a Cochran-Armitage test, and group medians with Wilcoxon and Kruskal-Wallis tests, all with Holm corrections applied across families of comparisons. Combine athletic metrics and Next Gen Stats (2016 onward) supplied the pre-draft and charted-efficiency context. All joins were guarded against many-to-many duplication.
Appendix: Terms Used in This Article
p-value. The probability of seeing a result at least this extreme by chance alone if there were truly no difference. Small p-values (close to 0) mean a result is unlikely to be luck; large ones (toward 1) mean it could easily be luck. A common cutoff for calling something real is 0.05.
Statistical significance. A result is called significant when its p-value clears the chosen cutoff, meaning we treat the difference as real rather than noise. Significance says nothing about how big the difference is, only that it is unlikely to be chance.
Effect size. How large a difference actually is, separate from whether it is significant. A gap can be statistically real (significant) but small in practical terms, like the half-yard-per-catch receiving gap in this study.
Odds ratio. A way to compare the odds of an outcome between two groups. 1.0 means no difference; above 1.0 means the first group is more likely; below 1.0 means it is less likely.
Holm correction. An adjustment applied when you run many statistical tests at once. Testing many things makes a false positive more likely by chance, so the Holm method raises the bar each test must clear, keeping the findings honest.
Fisher's exact test. A test for whether two groups differ in a yes/no outcome (for example, hit versus did not hit), reliable even with small samples.
Cochran-Armitage trend test. A test for whether an outcome rises or falls steadily across an ordered set of groups, used here to test whether hit rate declines across draft rounds 1 through 7.
Wilcoxon / Kruskal-Wallis tests. Tests for whether the typical value (median) of a measurement differs between groups, without assuming the data follow a bell curve. Used here to compare efficiency and receiving numbers across draft days.
Median. The middle value of a group: half are above it, half below. It is less distorted by a few extreme values than an average, which is why career-touch and efficiency figures here are reported as medians.
Spearman correlation. A number from -1 to 1 describing how strongly two ranked measures move together. Near 0 means little relationship; near 1 means they rise together strongly. The 0.27 between college and NFL receiving means a positive but loose link.
Monotonic. Moving in one consistent direction. A monotonic decline across rounds means each step tends to go down, never reversing, which strengthens the case that a pattern is real.
Tercile. One of three equal groups when data are sorted and split into thirds. “Top tercile by college receiving yards” means the top third of backs by that measure.
Survivorship / conditioning. The bias that arises when you only study the cases that made it past some filter. Measuring efficiency only on backs who earned 50+ carries conditions on competence, so the survivors look more equal than the full pool would.
Explore The Lab.


