The Two Doors of Fantasy Relevance: What Every Drafted Wide Receiver Since 2008 Reveals About Getting on the Field and Getting the Ball
I pulled data from 580 wide receivers from 2008-2025. This article gets into exactly what the NFL draft gives you, what differentiates the nobodies from the average and the elite, and what to do about wide receivers in both redraft and dynasty fantasy football.
LAB REPORTS
I pulled data from 580 wide receivers from 2008-2025. This article gets into exactly what the NFL draft gives you, what differentiates the nobodies from the average and the elite, and what to do about wide receivers in both redraft and dynasty fantasy football.
In July I pulled every running back drafted since 2008 to find out what draft capital actually buys at the position. The answer reshaped how I draft.
When I finished, one question wouldn’t leave me alone. Does the same thing happen at wide receiver? Is it similar, or is there something else going on entirely? (Spoiler Alert: It’s something else)
So I did it again. I pulled 580 wide receivers, drafted from 2008-2025. The good, the bad, and the ugly, spanning across 18 years.
What came back is the wide receiver version of the running back story, and while it’s a little more straightforward when it comes to what draft slot buys you, there are some details that go well against what is intuitive. At wide receiver, almost nothing you can look up before the draft beats the pick number. The receivers who get on the field, only need to figure out how to get the ball, not what they do after they get it. Age matters late in drafts, and the only external factors that seem to have influence are moving teams, changing quarterbacks, and the departure of a receiver ahead of you.
Not only will I dive deep into the data that tells that story, I will also give you names you can actually use in your 2026 drafts, dynasty and redraft alike. Did someone say Wan’Dale Robinson is back, again??
I want to make one important promise: This article is all about data, not vibes. When the data tells a story that goes against players I like, even takes I have made in public, I will say so, no matter how much it hurts me. I’ll do it more than once (RIP to my Romeo Doubs truthers out there)
What I Did
[Skip this part if you don’t care about the mechanisms of the data collection and analysis.] The spine of this study is 580 wide receivers drafted from 2008 through 2025. The headline analysis uses the 481 drafted from 2008 through 2022, so that every player has had at least three seasons to show something, with outcomes tracked through 2025. On top of that sits a snap-level layer built from participation data (2016 to 2025), a college-production layer built from play-by-play college data, and a season-pair panel for studying how roles change hands. It contains roughly 220 statistical tests across thirteen blocks. The exact details can be found in the Methodology section.
Act One: The Shape of the Draft
What Each Day Buys
This is the top of the funnel. For each draft day, Table 1 shows the share of receivers who ever posted a startable season, meaning a top-36 seasonal finish among wide receivers in points per reception scoring (the standard startable metric in a 12-team league), and the share who ever finished as a WR1, meaning a top 12 season finish.
|
Draft
day |
n |
Ever
WR1 (top-12) |
Ever
Startable (top-36) |
Median
career targets |
|
Round
1 |
57 |
45.6% |
70.2% |
520 |
|
Rounds
2-3 (Day 2) |
145 |
19.3% |
37.2% |
220 |
|
Rounds
4-7 (Day 3) |
279 |
3.2% |
9.3% |
29 |
Table 1. Share of drafted WRs reaching each fantasy outcome, and median career targets, by draft day (2008-2022 classes, PPR).
The gap between Day 2 and Day 3 is enormous, and it is not just because of luck. The p-value on that top-36 comparison is 4.7e-12. (A p-value is the probability of seeing a gap at least this large by chance alone if the two groups were truly identical. A small p-value means the result is very unlikely to be a fluke. Therefore a p-value of 4.7e-12, which is 0.00000000000047, means a gap this size would essentially never happen by chance, so the Day 2 versus Day 3 difference is about as certain as statistics gets.) Chance is not the explanation.
Now take a look at the median career targets column, because it previews the bulk of the article. The median Round 1 receiver draws 520 career targets. The median Day 3 receiver draws 29. The story of what the wide receiver draft predicts is not a “what I do after I get the ball” talent story. It is “how do I get the ball” story. The result from the draft is volume.
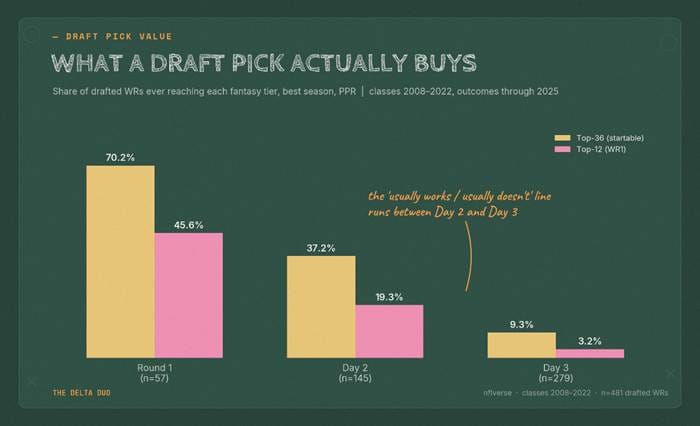
Chart 1. What a draft pick buys. The gap between Day 2 and Day 3 is the difference between a coin flip and a lottery ticket.
Plain-language takeaway: A Round 1 receiver usually becomes startable. A Day 2 receiver’s startability is roughly a one-in-three shot. A Day 3 receiver’s startability is a one-in-eleven shot, and the average Day 3 receiver barely plays at all.
Is There Actually a Cliff?
With the Running Back article there was a cliff when comparing draft days. For Wide Receivers, statistically, the decline is more of a ramp, not a staircase.
[DATA EXPLANATION. Disclaimer: This paragraph is data heavy, avoid it if you don’t care about how I determined the decline from a statistical standpoint.] I fit the hit rate against pick number using several curve shapes, and a smooth curve on the square root of pick number fit best. Adding round boundaries on top of that smooth curve added nothing. The formal test for that is a likelihood ratio test, which asks whether a more complicated model (a smooth curve plus round steps) explains the data meaningfully better than a simpler one (the smooth curve alone). It comes back at p = 0.16. (Recall that a large p-value means a result could easily be chance. Therefore a p-value of 0.16 means the round boundaries are more likely chance, than having statistical value. Nothing measurable happens when the draft ticks from pick 100 to pick 101.)
What does exist is a line where the smooth decline crosses from “usually works” to “usually does not,” and that line runs between Day 2 and Day 3. Call it a cliff if you want, because from your draft seat that is exactly what it feels like. Just know the cliff is presentational. The decline underneath it is continuous, steep, and merciless.
The difference between days is noticeable. There is no magic round at wide receiver. However, when diving more into Day 3, we do see a floor split: Rounds 4 and 5 produce startable (top-36) seasons at 15.7 percent, versus 3.9 percent for Rounds 6 and 7 (p = 0.0008), while the top-12 rate is statistically flat across all of Day 3 (p = 0.74). Early Day 3 buys a floor. It does not buy a ceiling. Rounds 4/5 have more startable players than Rounds 6/7, but they have the same rate of WR1’s. This will become a named-player argument later.
Inside Round 1: The Floor Drops, The Ceiling Does Not
Here is an exciting finding in Act One, and something you can take advantage of in drafts.
Within Round 1, being picked earlier makes you more likely to be startable. Top-10 picks hit the startable line at 88.9 percent versus 61.5 percent for picks 11 through 32. But it does not make you more likely to be elite. Among the 40 Round 1 receivers who ever became startable, pick number does not predict which of them turned into WR1’s at all. The odds ratio is 0.99 with p = 0.79. (An odds ratio compares the odds of an outcome as an input changes: 1.0 means no effect whatsoever, above 1.0 means higher odds, below 1.0 means lower. Therefore an odds ratio of 0.99 means moving up the Round 1 board changes a startable receiver’s WR1 odds by essentially nothing, and the p-value of 0.79 confirms that even the sliver of difference is noise.) The gap you see in the WR1 bars comes from the fact that more top-10 picks become startable in the first place, so more of them show up as WR1s. Once you look only at the 40 from Round 1 who became startable, it doesn’t matter at all where you’re drafted within it: top-10 picks became WR1s 62.5% of the time, while picks 11 through 32 did it 66.7% of the time. Statistically, this is due to chance and not a predictable reason.
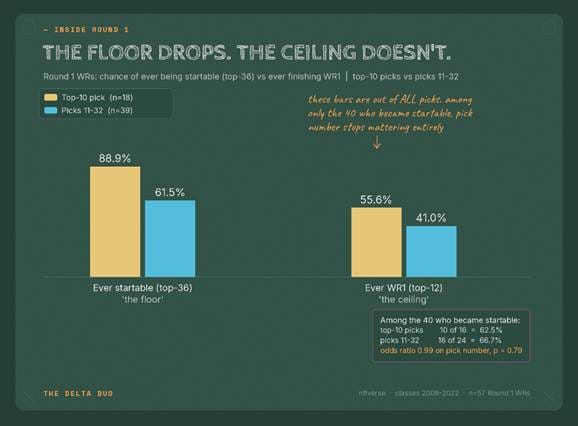
Chart 2. Inside Round 1, draft capital buys a floor, not a ceiling.
Plain-language takeaway: Being a top-10 pick makes a receiver meaningfully more likely to be startable, but does not make them more likely to be an elite WR1, that likelihood is the same no matter where you’re picked within Round 1. Draft capital buys you safety, not stardom.
Act Two: Everyone Who Gets The Ball, Plays the Same
Now the finding that makes everyone seem a lot more equal than we think.
Take every receiver who earned a real workload, which I am defining as 150 or more career targets. Now measure how good they are per opportunity, fifteen different ways: yards per target, catch rate, average depth of target, yards after the catch, PPR points per target, and ten more.
After a Holm correction, exactly 0 of 15 metrics separate Day 2 from Day 3. (A Holm correction is a standard adjustment applied when you run many tests at once. Running fifteen tests makes at least one false positive likely by luck alone, so the Holm method raises the bar each test must clear. Therefore zero survivors after correction means not one of these fifteen efficiency gaps is real.) Across all seven rounds, PPR per target is flat: Round 1 receivers produce 1.746 points per target and Round 7 receivers produce 1.743. Three thousandths of a point. As you can see in the table below, the rest of the metrics are fairly flat as well. Even the widest gap, Round 1 vs. Day 3 PPR per target, does not survive correction and therefore is not statistically significant.
|
Draft day |
n |
Yards/target |
Catch % |
YAC/reception |
PPR per target |
|
Round 1 |
47 |
8.20 |
60.1% |
4.16 |
1.746 |
|
Day 2 |
86 |
7.82 |
61.5% |
4.21 |
1.722 |
|
Day 3 |
58 |
7.68 |
60.6% |
4.28 |
1.703 |
Table 2. Production among WRs with 150+ career targets, by draft day. None of these gaps survive correction.
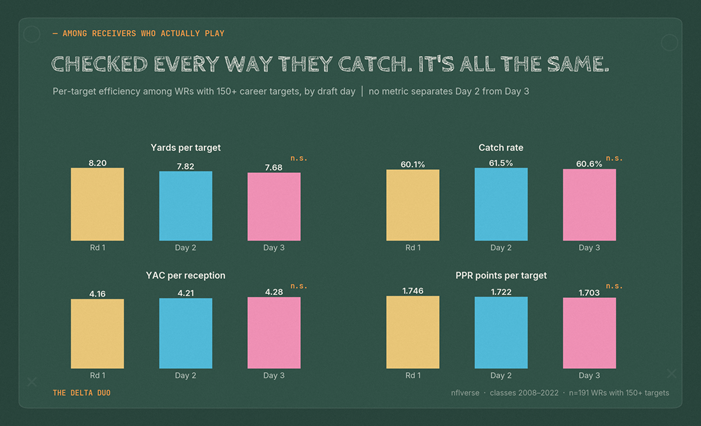
Chart 3. Among receivers who actually play, per-target quality is indistinguishable across draft days. “n.s.” means not statistically significant.
So where does the production gap come from? At the 150-target bar, 94% of the fantasy points gap between draft days is volume. Six percent is efficiency, and that six percent is itself not statistically distinguishable from zero.
Let’s relate it exactly to fantasy: The median Round 1 receiver season in this group scores 12.35 PPR points per game. The median Day 3 receiver season scores 7.49. Over an entire season that is roughly a 78-83 point gap (range because we are using both 16 and 17 game seasons in data). Furthermore, when you measure targets per game directly, with media Round 1 seeing 6.8 targets per game and a Day 3 receiver seeing 4.6, the entire gap is about 2.2 targets per game. The difference between a first-round receiver and a seventh-round receiver who both earned real roles is not, on average, talent per touch, at least by these metrics. You can see that when comparing their average PPR points per target, they are both about 1.7. The difference is about 2-3 extra targets per game of trust from the offense.
What’s even more telling is when you consider the percentage of games where a wide receiver played in the entire game but had zero targets, absolutely NO usage at all:
|
Draft day |
Percent of Games with: No Targets – No Catches – No Points |
|
Round 1 |
1.5% |
|
Day 2 |
5.4% |
|
Day 3 |
17.1% |
A Day 3 receiver is 11 times more likely than a Round 1 receiver to play in a game and get no points at all.
Plain-language takeaway: Once a receiver is actually being used, you cannot tell what round he was drafted in from how well he plays per target when considering the above metrics. The production gap between early and late picks is almost entirely how often they are thrown the ball, not what they do with it.
Act Three: Both Doors - Snaps and Targets
If per target quality is fairly equal, what gates the volume? This is where the snap level data comes in, and we see that getting targets is led by getting snaps on the field.
The Snap Gate
Using participation data from 2016 through 2025, I measured every drafted receiver’s share of his team’s pass snaps, meaning the fraction of his team’s dropbacks he was on the field for. This is not routes run, which is proprietary charting data. Table 3 compares field time with reaching the 80 target line in the same season.
|
Share of
team pass snaps |
n |
Median
targets |
Reached 80
targets |
|
Under 25% |
484 |
9 |
0.0% |
|
25-50% |
265 |
42 |
4.5% |
|
50-70% |
197 |
65 |
27.9% |
|
70-85% |
206 |
96 |
78.6% |
|
85%+ |
184 |
132 |
98.4% |
Table 3. The snap gate: reaching an 80 target season by share of team pass snaps, 2016-2025.
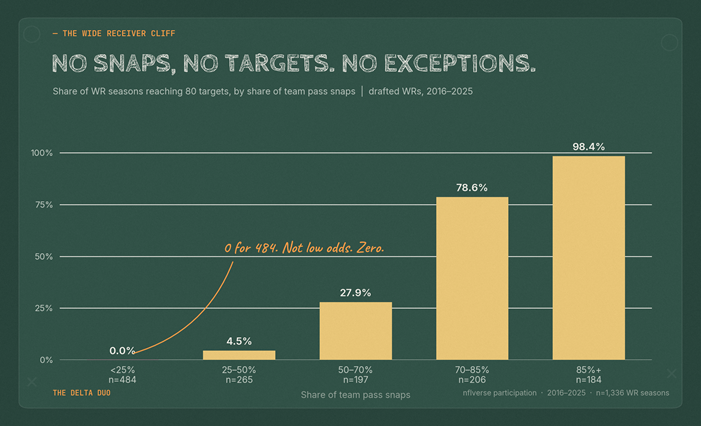
Chart 4. The snap gate. No receiver under a quarter of his team’s pass snaps has ever reached 80 targets, and above 85 percent of snaps the 80 target season is nearly automatic.
I also re-derived this table independently from raw play-by-play data, in a different programming language than the original study, and got the same zero on an even larger sample. The snap gate is real, and it leads to the target gate. You cannot earn the volume that makes you fantasy relevant without first being on the field, and the 80 target season is close to automatic once a receiver lives above 85% of snaps.
The Residual That Should Bother You
Here is the uncomfortable part. Draft capital buys snaps: the median Round 1 receiver plays 71.7%, Day 2 plays 64.8%, and Day 3 plays 46.7%. That makes sense, coaches allocate playing time to their investments. But even when holding field time constant, Day 3 receivers are targeted less at every level of snap share. Same time on the field, fewer looks. 97% of the per-snap production gap between Round 1 and Day 3 is being targeted more often while on the field, not doing more with each target. This finding lends itself to another consideration, that what you do with the ball doesn’t matter, it’s getting yourself open that truly determines a receiver’s rise to the top.
There are two doors then, that a successful receiver must get through. Door One: Get on the field. Door Two: Get into the quarterback’s read progression. Draft capital holds both doors open. A late-round receiver must force each one open separately.
The Two Absolutes
Now there are two absolutes in this study and they are worth talking about.
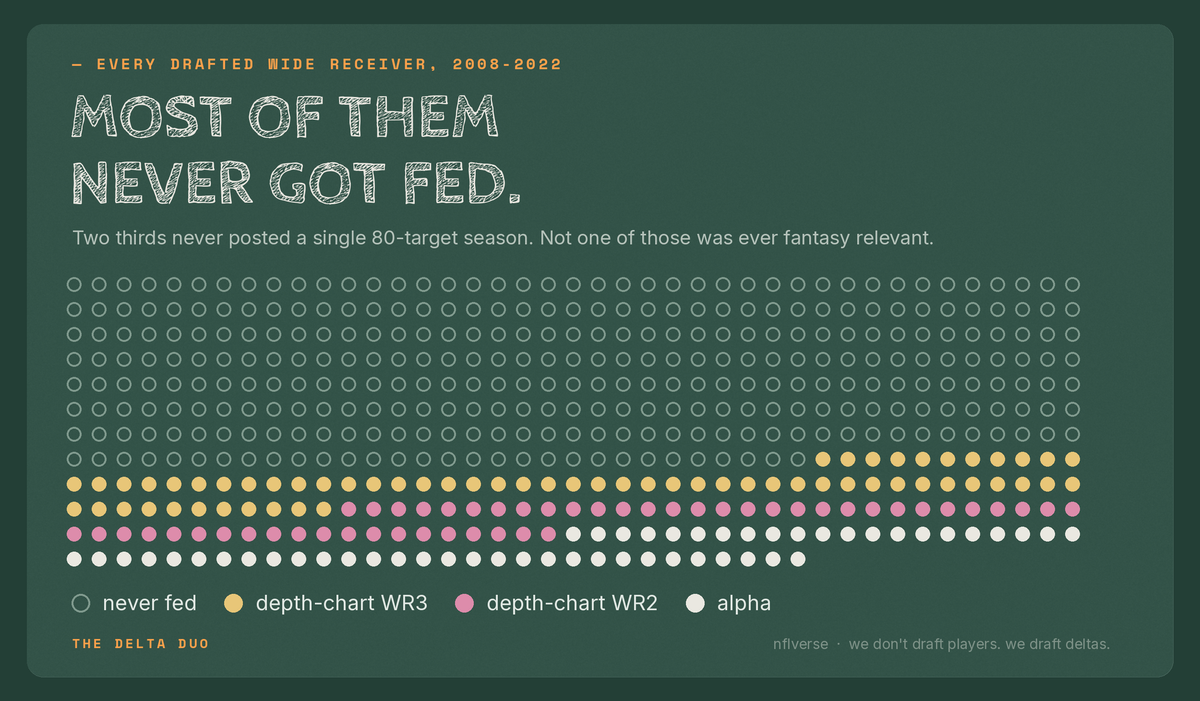
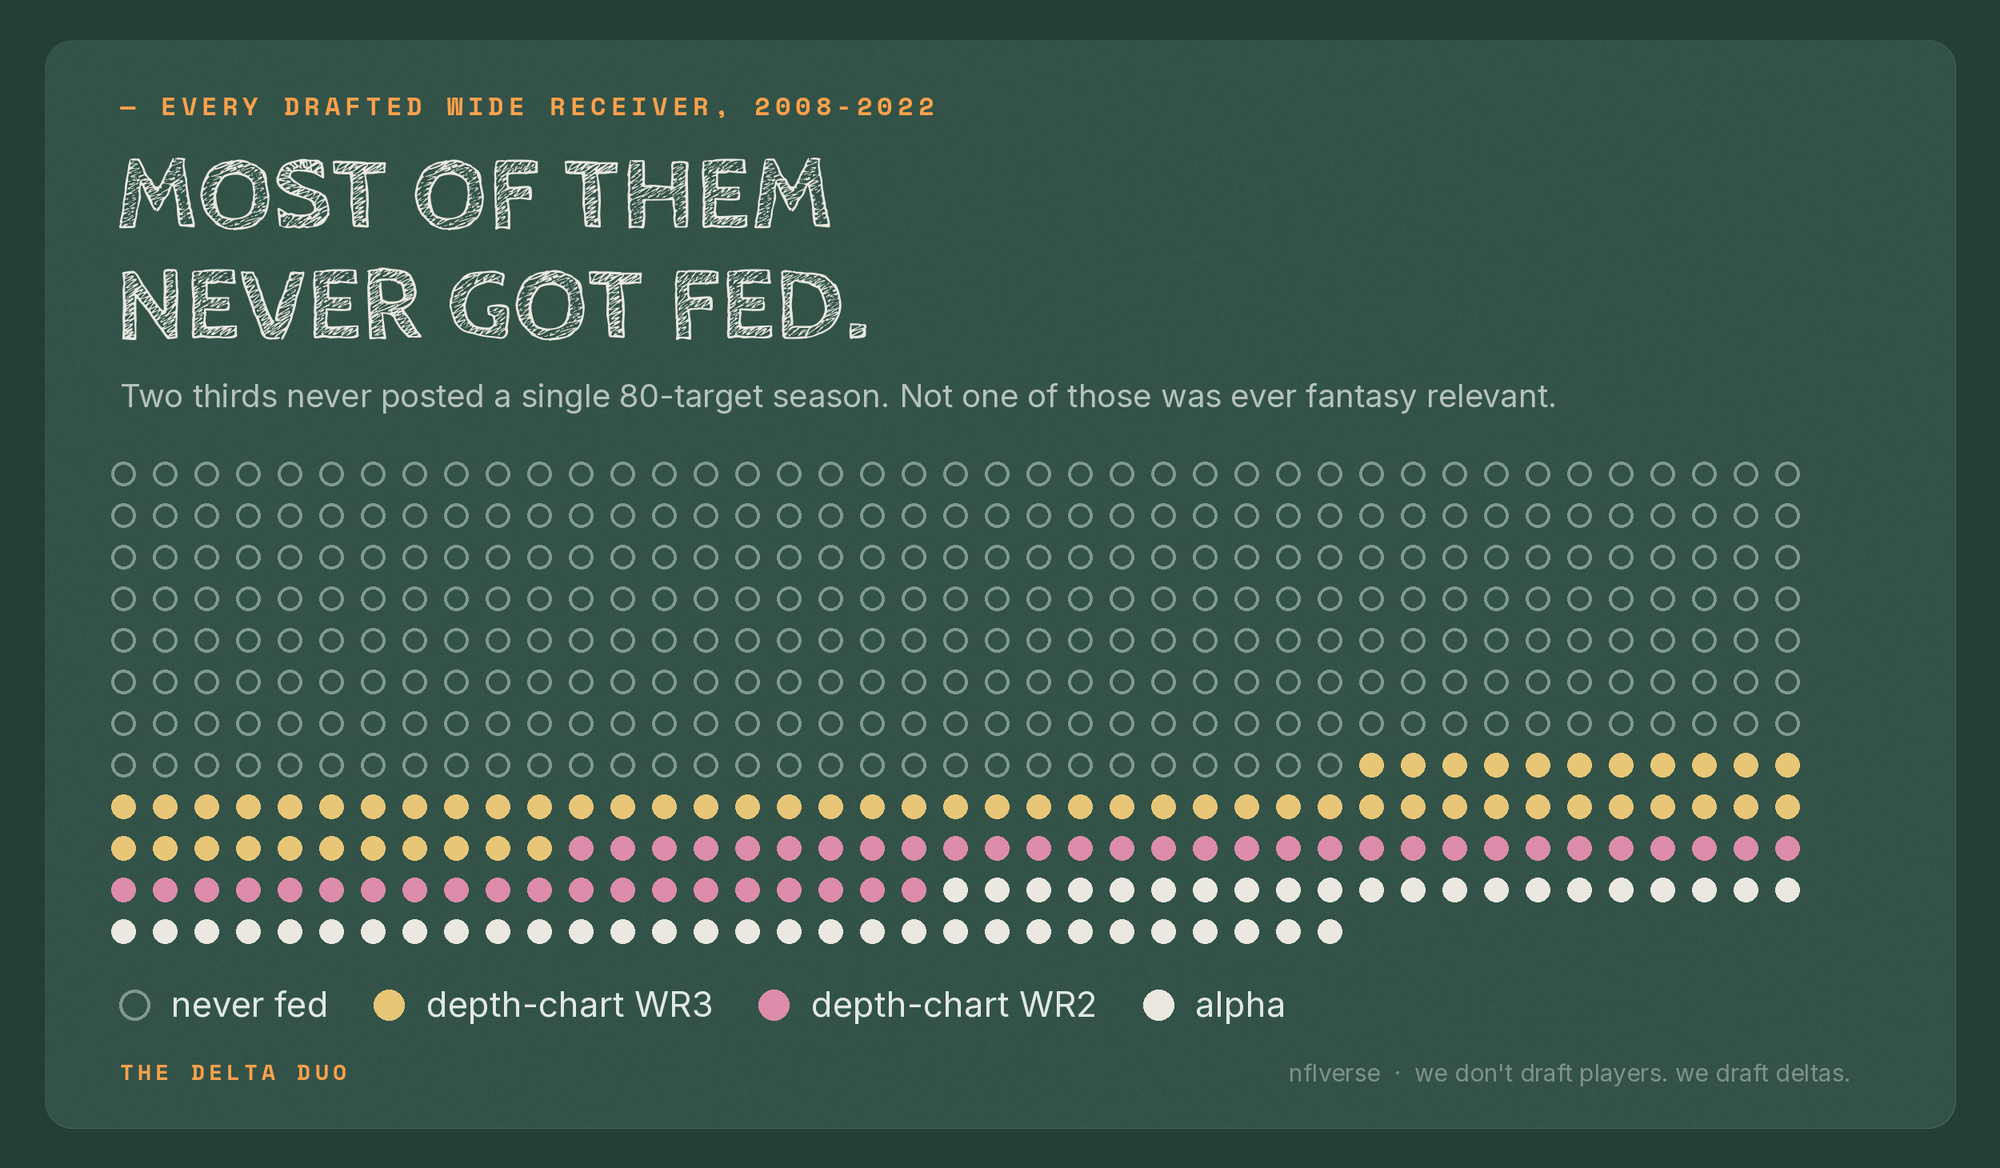
0 of the 317 drafted receivers who never posted a single 80-target season were ever fantasy relevant. Not one, not from Round 1 and not from Round 7. And this phenomenon goes both ways: of the 72 receivers in the study who posted four or more 80-target seasons, all 72 were fantasy relevant. 100%. The 80-target season is the gate between relevance and irrelevance.
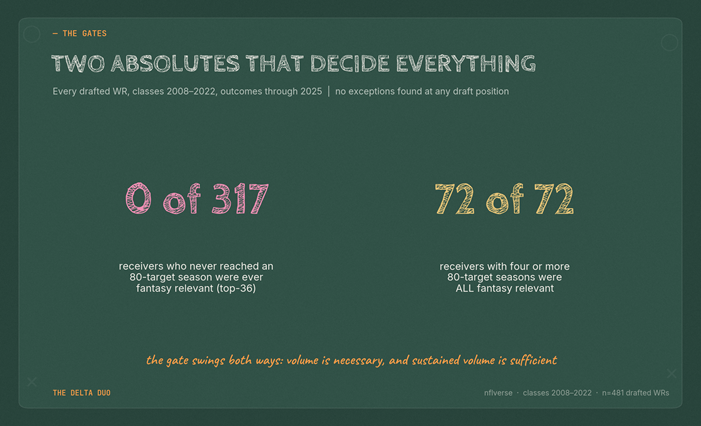
Chart 5. The two absolutes. Zero exceptions in either direction across 481 drafted receivers.
In between those two absolutes sits a ladder, and it is worth discussing because it separates two things easy to blur: a team’s depth chart role and a fantasy finish.
|
Best
career role (peak season targets) |
Ever
Fantasy WR1 |
Ever
startable |
|
Alpha,
140+ targets (n=51) |
84.3% |
98.0% |
|
Depth-chart
WR2, 110-139 (n=50) |
38.0% |
84.0% |
|
Depth-chart
WR3, 80-109 (n=63) |
1.6% |
39.7% |
Table 4. Fantasy outcomes by a receiver’s best career depth-chart role.
Read the bottom row again. Within that group of 63 receivers, 58 of those were drafted outside Round 1, and they peaked in the 80 to 109 target band, which is a real NFL job, and a starting-caliber NFL depth chart role. However, 0 of those 58 ever finished as a fantasy WR1. The one player within that range of peak season targets (80-109) who did, was a Day 1 guy. It takes a depth-chart WR2 workload, 110 targets or more, to reliably produce a fantasy WR3 season. And at the very top of the ladder, draft position stops mattering entirely: among receivers who reached the alpha tier, Round 1 picks became WR1s at 86.4 percent and Day 3 picks at 77.8 percent, a difference that is statistically nothing (p = 0.61). Tyreek Hill and Antonio Brown were not efficiency miracles. They were Day 3 receivers who got alpha volume, and alpha volume converts to fantasy WR1 seasons at the same rate no matter where a player was drafted.
Plain-language takeaway: Fantasy relevance at receiver has a hard prerequisite, the 80-target season, and that prerequisite has its own prerequisite, being on the field. Draft capital’s real product is access: to snaps first, then to targets. Once a receiver of any pedigree reaches true alpha volume, he finishes fantasy WR1 at the same rate across all the NFL draft rounds.
Act Four: What the Scouts Can't Sell You
Every draft season, an industry sells you reasons to believe in specific receivers: forty times, dominator ratings, breakout ages, landing spots. So I tested all of it. Every pre-draft signal available in free public data, checked against outcomes with draft position as a controlled variable.
Controlling for draft position matters, so let me be clear about why. NFL teams already price public information into the draft slot. So the useful question is never “does this stat correlate with success.” It is “does this stat tell you anything the pick number did not already tell you.”
Here is the board after roughly 220 tests.
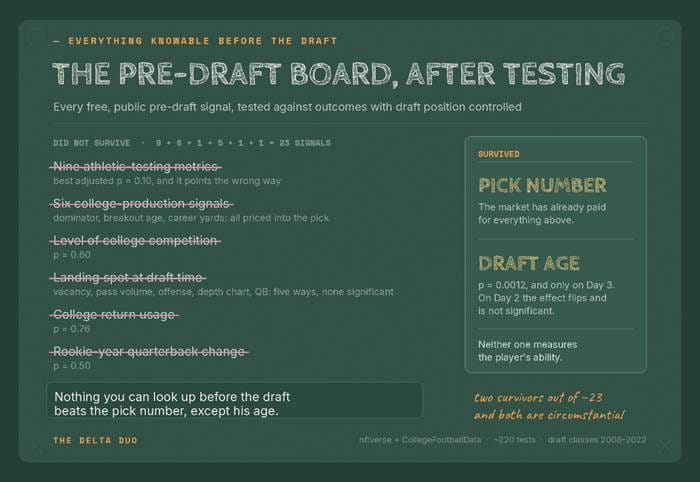
Chart 6. The pre-draft board after testing. Two signals survive. Neither one measures ability.
Nine athletic-testing metrics: nothing statistically significant. The best of them, after correction for multiple testing, sits at an adjusted p=0.10 and still points in the wrong direction. Six college-production signals, including dominator rating (a receiver’s share of his college team’s receiving production) and breakout age: not significant as direct predictors. Level of college competition: not significant (p = 0.60). Landing spot at draft time, tested five different ways (target vacancy, pass volume, offense quality, depth chart, quarterback): all not significant. College return usage: not significant. Losing or changing your quarterback as a rookie: not significant.
Two things survive. Pick number and draft age. Both are circumstantial. Neither is a measurement of the player’s ability.
College Production Is Priced In, Not Predictive
I want to be precise about the college numbers, because “college production doesn’t matter” is not what the data says. College production correlates strongly with outcomes: a receiver with a big college resume hits more often. But it correlates because NFL teams already drafted him earlier for it. Career college receiving yards carry a raw odds ratio of 1.85 per standard deviation (p = 0.00001), and once you control for where he was picked, the effect shrinks by half and dies (adjusted p = 0.10). Dominator rating shows the same pattern, a 51 percent shrinkage. Breakout age shows it too, and it was the weakest of the family to begin with.
This answers a question I get constantly: What does college production get you per round? The answer is that it gets you the round. By draft night, the market has already paid for the college tape. A big dominator rating buys you nothing extra within a round, in any round. I tested that interaction directly and it is flat (p ranges from 0.30 to 0.81 across specifications). One honest limitation: contested-catch rate, drop rate, and yards per route run are proprietary charting stats I could not test. Untested is not disproven. However these untested stats resonate with the consideration I brought up earlier, that it is getting open and proving your reliability to actually get the ball, that earn a player the target volume and overall success; it is not what you do with the ball after you get it.
Age: The One Scouting Adjacent Signal That Lives
Age is the only thing that, within Day 3, seems to matter. It should be noted that within Day 3, the correlation between age and pick is essentially zero (r = 0.038, this means that there is no natural connection between the two. For example, an older player is not more likely to be picked later, and vice versa). So what’s the catch? Within Day 3, the older you get, the less likely you are to get targets and be fantasy relevant.
|
Day 3 age at season start |
n |
Ever startable |
Ever reached 150 career targets |
|
21 or under |
29 |
17.2% |
37.9% |
|
22 |
116 |
12.1% |
28.4% |
|
23 |
107 |
6.5% |
14.0% |
|
24 or over |
22 |
0.0% |
0.0% |
Table 5. Day 3 outcomes by age, age calculated near season start, September 1st to account for differences in opening of season per year.
Age 24 and older Day 3 receivers are 0 for 22 in this study. Twenty-two players is a small group and zero is not destiny, but the gradient above it is smooth and strongly significant (p = 0.0012 in the joint model), and it survives every robustness check I ran. This is a late-round signal, not a universal one: on Day 2 the age effect flips slightly and is not significant. This is purely a Day 3 statistic. As age increases, the percentage of both a) reaching 150 career targets and b) becoming a startable fantasy WR, both decrease.
|
Day 3 bucket |
n |
Earned a real role |
Ever startable |
|
Early half of Day 3, age 22 or under |
73 |
32.9% |
20.5% |
|
Early half of Day 3, age 23+ |
68 |
14.7% |
7.4% |
|
Late half of Day 3, age 22 or under |
72 |
15.3% |
5.6% |
|
Late half of Day 3, age 23+ |
61 |
3.3% |
3.3% |
Table 6. Day 3 startable rate by pick half and draft age. Earned a real role = at least one 80+ target season. Ever startable = at least one fantasy WR3 finish (top 36).
Early vs. Late half of Day 3 is calculated at the median on Day 3, which is roughly pick 182. Therefore that means that the early half of Day 3 encompasses Round 4, Round 5, and the beginning of Round 6. Late half of Day 3 means the later part of Round 6 and Round 7. What stands out the most is that older players on early half of Day 3 are statistically equal to younger players on the late half of Day 3. But if you’re young and in the early half, you have a significantly better chance of getting a real role, in both real football and fantasy football. However, if you’re the old and on the late half of Day 3, the odds for both outcomes are less than 5%. (Let it be known I am 30 so it feels WEIRD to call 23, old…but I must for the sake of the article.)
Can't a Receiver Just Play His Way In?
He can, but it is often done slowly and painfully. I measured how much future volume a receiver earns by playing well, using 1,113 season pairs. Efficiency does earn targets: a standard deviation of yards per target buys about 0.44 targets per game the following season, and the same pattern holds for snaps (play well, get on the field more; be on the field more, get targeted more). You absolutely can play well and rise within the ranks of startable and relevant wide receivers.
However, current volume carries a coefficient of 0.764 on future volume, which means roles are sticky, and when you do the convergence math, closing the 2-3 target per game gap from Act Two requires multiple years of sustained elite efficiency. That is asking for top-tier play, on rosters that most often will not keep a late-round receiver long enough for that to happen. Of the Day 3 receivers still unfed (never having an 80+ target season) entering year three, 7.5 percent are ever fed at all.
Plain-language takeaway: Nothing you can look up about a receiver before the draft beats the pick number, except his age when the season starts, and that only matters on Day 3. College production is real but already priced into the pick. And while good play does earn opportunity, on average it earns it far too slowly to rescue most late picks. Which means the fast path to volume has to be something else…
Act Five: The Timeline
This section exists because dynasty and redraft are different games, and the difference between them is time. So…when do the hits actually arrive?
|
Draft day |
Top-12 as a rookie |
Top-36 as a rookie |
80+ targets as a rookie |
|
Round 1 |
11.6% |
44.2% |
55.8% |
|
Day 2 |
2.1% |
13.7% |
18.9% |
|
Day 3 |
0.5% |
1.6% |
3.8% |
Table 7. Rookie-year hit rates by draft day, 2016-2025 classes.
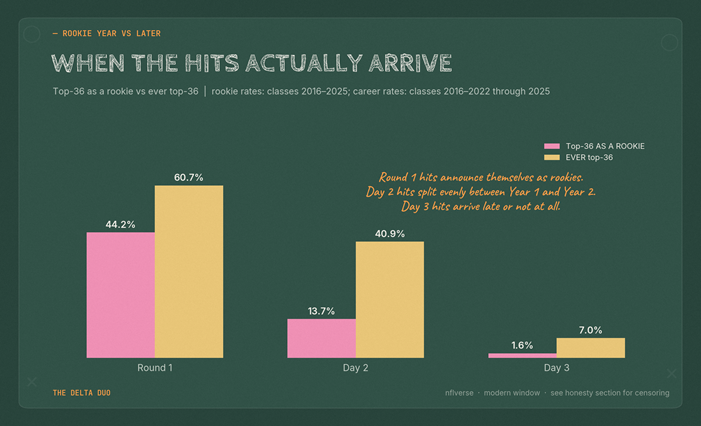
Chart 7. The timeline. Rookie-year rates from the 2016-2025 classes; career rates from the 2016-2022 classes tracked through 2025.
A majority of first-round receivers, 55.8 percent, walk through the 80-target gate as rookies. This is the single most redraft-relevant number in the study: Round 1 rookie receivers are live fantasy picks immediately, before they have proven anything, because the volume arrives with the draft slot. While they still are less likely to have a top-36 season than not, 44.2% is still a decent risk worth taking on any 1st rounder.
Day 2 is a different animal. Among Day 2 receivers from the 2016 to 2022 classes who ever became startable, the first startable season came in Year One only 37% of the time and in Year Two 41% of the time. Year Two is the Day 2 breakout window. In redraft, a Day 2 rookie is usually a late-round flier at best. In dynasty, the cheapest moment to buy a Day 2 receiver is after a quiet rookie year and before the year-two window opens, which is precisely when frustrated managers sell.
Day 3 receivers essentially do not hit as rookies: Only 1.6%. The exceptions are legendary precisely because they are exceptions, and I will come back to what the most famous ones, Puka Nacua and the other alpha-volume Day 3 receivers of Act Three, had in common.
The clock runs out fast. If a receiver has not posted a startable season by the end of year two, the chance he ever does is 21.4% for Round 1 picks, 13.3% for Day 2, and 3.2% for Day 3. On the volume side, the study’s hazard table says the same thing: 61.5% of all first 80-target seasons happen by career year two, and 78.8% by year three.
Plain-language takeaway: In redraft, trust Round 1 rookies right away, treat Day 2 rookies as bench stashes, and do not draft Day 3 rookies at all. In dynasty, the buy signal is players in the Day 2 year two window, and the sell signal is any Day 3 receiver entering year three without a feed, because only 7.5% of those are ever fed.
Act Six: Movement, or How Roles Actually Change Hands
If a player getting fed is the most important thing, but they don’t have early round draft capital or the time to develop that it usually takes, what else can afford them that opportunity? The next best thing, that they have no control over is, someone ahead of them leaves.
The Acquisition Rule
Considering 805 “at risk” player seasons (a season for which a receiver has never yet had an 80-target season), the single biggest thing that changed their odds of getting those 80 targets was whether the team’s leading receiver departed that offseason.
|
Situation |
n |
First-feed
rate |
|
Team’s
leading WR departed |
168 |
12.5% |
|
No
departure |
637 |
4.9% |
Table 8. First-feed rate by whether the team’s leading receiver departed that offseason.
This means that 12.5% of those players were finally fed 80+ targets when the leading receiver left, while only 4.9% finally got 80+ targets if the leading WR stayed behind. That is an odds ratio of 2.79 with p = 0.0011. (This strengthens rather than weakens under a cluster bootstrap, a resampling method that reshuffles the data by player rather than by season so that one player’s many seasons cannot masquerade as independent evidence).
An important distinction to make: It is departure, not decline. An aging alpha who merely slows down opens nothing (6.3% versus 6.5%, p = 1.00). The vacancy buys access to targets, not an increase in efficiency when that receiver gets the ball. Once fed, being given 80+ targets, the conversion to a startable season is identical with or without a leaving leading receiver. With draft age though, it compounds. A vacancy, plus being drafted at 22 or younger feeds at 16.1%; no vacancy, plus being drafted at 23 or older feeds at only 2.0%.
There is also a quarterback version of the rule, and it points the opposite way. Among receivers who already hold a role, a departing quarterback roughly halves the odds of keeping it, from 49% to 26% (odds ratio 0.43, p = 0.026, statistically significant), and the effect is about turnover itself, not the quality of the replacement. It doesn’t matter if the new quarterback is a fresh rookie or a seasoned veteran, a quarterback being replaced produces identical retention of a receiver role. That’s not to say that a quarterback can’t change a player’s role, it absolutely can. But on average, a new quarterback is a bad thing if the wide receiver already has a solid target share. Consistency is best for good wide receivers.
This also finally explains a puzzle I considered in Act Four, why landing spot at draft time predicts nothing. Because 73% of first feeds (80+ targets) happen in year two or later. The depth chart a receiver is drafted into is not the depth chart he eventually breaks through.
What Happens When the Receiver Is the One Who Moves
The study told us what happens when the man ahead of you leaves, or a new quarterback comes in. It never directly answered the mirror question: What happens when a receiver changes teams? I built that analysis for this article from the 2016 to 2025 season pairs.
|
Prior season volume |
Stayed on the same team |
Moved teams |
p |
|
Fringe role 80-99 targets |
58.7% kept an
80-target role (n=92) |
32.4% (n=37) |
0.011 |
|
Mid role 100-119 targets |
72.8% (n=92) |
56.5% (n=23) |
0.137 |
|
High volume 120+ targets |
81.9% (n=138) |
85.7% (n=14) |
1.00 |
Table 9. Retention of an 80-target role, stayers versus movers, by prior-season volume.
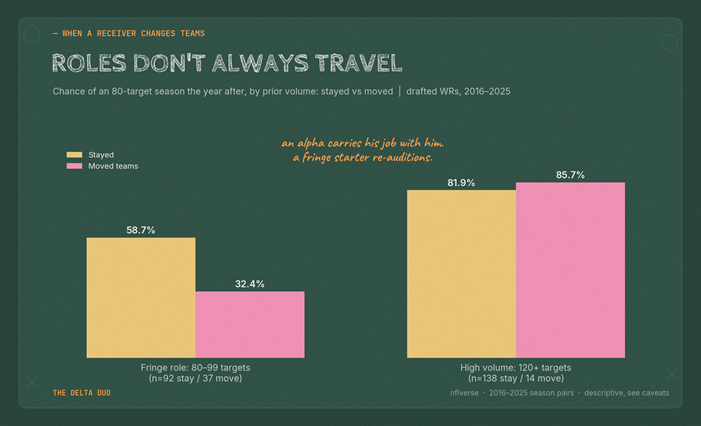
Chart 8. Roles don’t always travel. The damage from moving concentrates entirely at the fringe.
An alpha carries his job with him. A fringe role-holder who moves is reauditioning, and the reaudition fails two times in three. The gradient is clean: the more volume you had, the safer the move.
A conversation worth having on this particular analysis: Receivers who move are not a random sample. Fringe movers in this data are a median of 28 years old versus 24 for fringe stayers, and teams tend to let go of players they have already soured on. When I control for age, prior volume, and prior finish in one model, the pooled move effect washes out, and even within the fringe band the controlled effect stays large (moving roughly halves the odds) but slips to p = 0.10. Restrict to young fringe movers only, 26 or under, and the gap is significant again, 62.7% versus 28.6% (p = 0.035), however this is on an admittedly small sample of 14 movers. So I cannot tell you whether the move causes the decline or merely marks the player his old team was already done with. Here is why I am comfortable publishing it anyway: For fantasy football, the distinction does not matter. Either way, the fringe receiver on a new team keeps his role about one time in three, while the market prices his “fresh start” like a promotion.
And the question of, does moving teams help a never fed player get targets, fails too. Never-fed Day 3 receivers who changed teams got their first feed at 3.8% versus 6.4% for those who stayed. Moving is not the mechanism. The man ahead of you leaving your building is the mechanism.
Three Receivers Who Moved This Offseason
Theory is nice. However it is August 2026 and these three are on draft boards right now.
Wan’Dale Robinson, Giants to Titans. Here is the mover that the data, and myself, believe in. Robinson is coming off 140 targets and a 29.7% target share in New York, which puts him firmly in the high-volume band where the role travels with the player (movers at 120-plus targets kept an 80-target role 85.7% of the time). He is 25, reunites with the coordinator who fed him, and Tennessee had a large vacancy (30.9% target share). Our model ranks him WR16 dynasty, WR21 redraft. The one honest caution: Tennessee then spent the fourth overall pick on Carnell Tate, which adds real target competition, on average 21.6% target share for rookies drafted picks 1-11. However, I still trust the volume history.
Verdict: Draft with confidence in both formats; he predicts as a fantasy WR2.
Romeo Doubs, Packers to Patriots. Full disclosure: I have been a Romeo Doubs believer for three years now, but this analysis is exactly why the study exists, to challenge our assumptions. And boy did it challenge mine about Doubs... Doubs posted 85 targets in 2025, which is the textbook fringe band, and fringe movers keep an 80-target role about one time in three. Worse, the vacancy he signed into evaporated: New England’s offseason departures vacated 27.2% of targets, but the arrivals behind him, including alpha WR, A.J. Brown, in a trade, added back 54.8% (this is not a one for one since the target share is coming from other offenses and rookies, but Brown is a big concern for Doubs’ potential volume). Therefore, his net vacancy is quite negative. The model has him WR53 in both formats.
Verdict: In redraft he is a bench dart priced like a starter, so do not pay the “new team, big contract” premium. In dynasty, hold if you have him, but this is a sell into optimism window, not a buy.
Jalen Nailor, Vikings to Raiders. This right here is opposite case. Nailor has got a lot of buzz in the offseason since the Raiders WR room is so undecided, but the numbers are not in his favor. Nailor is not a role-holder (53 targets in 2025), and never-fed movers almost never get fed, roughly 4%. However, it should be noted that he is the rare longshot with an actual mechanism: Las Vegas has a decent vacancy of last year’s targets, 21.3%, and then when accounting for offseason additions, Nailor included, the net vacancy is in the positive at 2.5%. Only 10 NFL teams have a positive net vacated targets percentage, which is worth noting. Vacancy is the one variable that historically moves the first-feed needle, so the opportunity is there. The model says WR101 dynasty, 100 redraft.
Verdict: He is free. In deep dynasty he is a defensible final roster spot dart, because the one signal that matters points his way. In redraft, watch-list only. Do not draft him and do not talk yourself into more than that.
If Vacancies Matter So Much, Where Are They in 2026?
Since vacancy is the engine, here is the current map (Calculated by departed players’ 2025 target shares, summed by their former team’s 2026 roster).
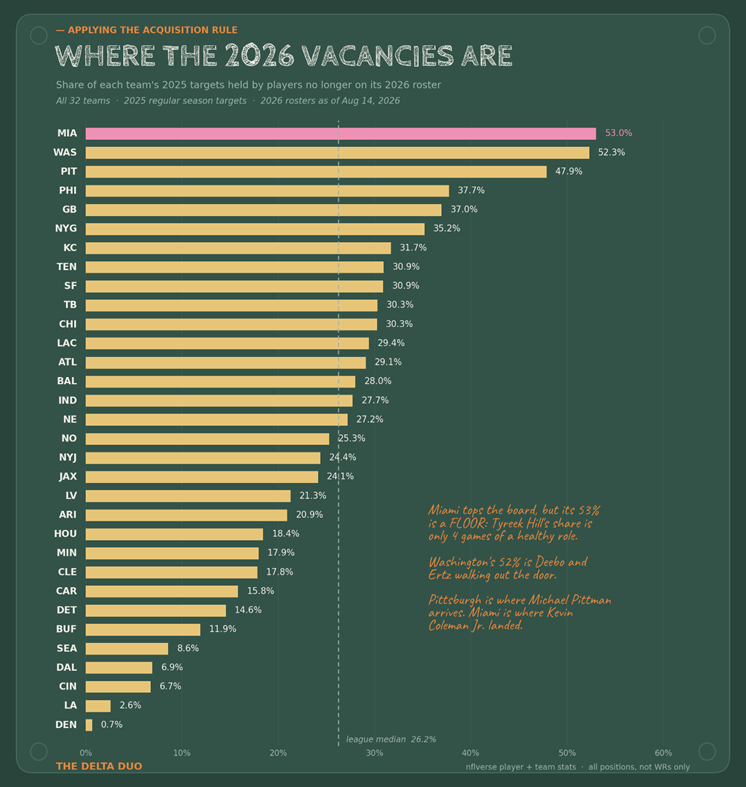
Chart 9. The largest vacated target shares by 2026 team. Miami, Washington, and Pittsburgh cleared the most opportunity this offseason.
Miami’s has the most vacancy of any team, 53.0%, and that’s where a certain fifth-round rookie landed; we’ll talk about him later. Pittsburgh’s 47.9% vacancy compared to last year is where Michael Pittman arrives with 111 targets of 2025 volume, one of the best pure landing-spot bets among veteran movers this year (the model: WR51 dynasty, WR48 redraft, and his personal 42.3% net vacancy, adding in new players this year but also excluding his own target share, is the largest of any established mover). Stefon Diggs also landed somewhere with massive vacancies, at Washington with 52.3%, something worth considering. The teams to look out for are on this list. Pay close attention to their additions because someone will take those targets, and for some of those players, it may be a big jump in their fantasy relevance.
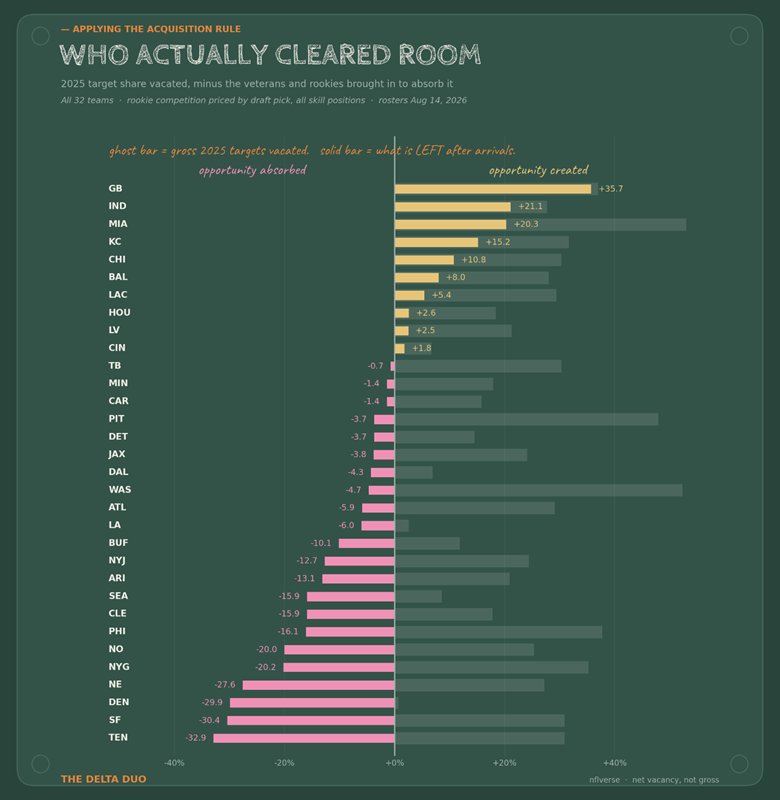
Teams with positive net vacancies have an excess of target share. This includes WRs, TEs, and RBs and rookies are calculated by the average target share the rookie season based on draft pick location, for all positions, each calculated by grouping with their position group. A negative net vacancy doesn’t mean that new incoming wide receivers have no opportunity, they are part of the calculation, for example, New England looks like it has a very big net negative, but A.J. Brown brought in most of that, and he will most likely command most of the targets in New England. This however, gives an idea of the landscape new wide receivers are walking into. A positive vacancy means that if the team threw the exact same amount of passes, someone in that offense statistically has to have a higher target share than they had last year. The opportunity is much more available to them.
Plain-language takeaway: Roles change hands mainly through departures, not through skill. A vacancy ahead of a young receiver roughly triples his odds of a first feed (80+ targets); a departing quarterback halves an established receiver’s odds of keeping his role; and a fringe receiver changing teams keeps his job only one time in three, whatever the signing-day press conference says.
Act Seven: The Era Turn
One more interesting finding before I get into some more concrete names, because it is telling a story we can’t totally explain, but is worth hearing.
Compare mature Day 3 classes across eras. Receivers drafted from 2008 to 2012 became startable at 14.9%. Receivers drafted from 2013 to 2019: 4.4%. That is not a cherry-picked boundary. The boundary-free trend test (a test that looks for a steady rise or fall across ordered groups without me choosing a cut point) gives p = 0.0101, and a per-year model says Day 3 hit odds have declined about 17% per draft year across the panel.
Here is what makes it strange. The roles did not disappear. The league still produces the same number of 50+, 80+, and 110+ target jobs per team as it did in 2009, almost eerily stable (p = 0.94 and 0.79, no meaningful variance). And Day 3 receivers still enter the league’s front door at the same rate: reaching 50 career targets is unchanged across eras. So what changed? It’s who gets the good jobs. Here’s how to read the table below: For Top-12 finishes, of everyone who finished as a fantasy WR1 (Top 12), late-round picks were 21.7% of them early in the era and 21.3% late. Unchanged. Late-round (drafted round 4 or later, including UDFA) guys still claim about a fifth of the elite finishes.
|
Fantasy tier |
Late-round share, first 5 years |
Late-round share, last 5 years |
Trend p |
|
Top-12 |
21.7% |
21.3% |
0.859 |
|
Top-24 |
32.5% |
17.5% |
0.0088 |
|
Top-36 |
32.2% |
20.6% |
0.0048 |
Table 10. Late-round share of each fantasy tier, first five years of the panel versus last five.
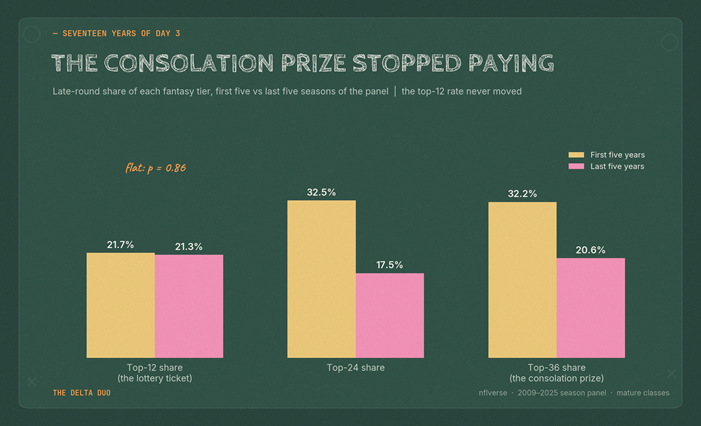
Chart 10. The era turn. Late picks still produce their share of true WR1 seasons. The middle-class outcomes are what vanished.
The median Day 3 success story used to peak at 111 targets in a season. Now he peaks at 81. The WR2 and WR3 middle class that late-round picks used to occupy has been fenced off, while the true outlier rate, the Tyreek Hills and Amon-Ra St. Browns, has not budged. Same amount of Day 3 elite outliers, much less middle tier guys, WR2’s and 3’s.
So, what’s the reason for this shift?: I couldn’t find it. I tested target concentration (it moved the wrong direction), tight ends and running backs eating the share (WR share is stable near 60 percent), fewer roles (no), and league volume decline (real, but it explains at most a third of it). No bucket of the draft demonstrably absorbed the lost seasons. The pattern is legitimate but the cause is unidentified. It is going to be found in something that these numbers don’t see. I intend to keep looking into it, but for the scope of this article I will leave it at that. It happens, it is clearly not by chance, but the true reasoning is still obscured.
Plain-language takeaway: A Day 3 receiver pick today is a nearly pure lottery ticket. The old middle outcome, a couple of usable WR3 seasons, has mostly stopped existing. This raises the bar for spending even a late dynasty rookie pick: if the profile does not have genuine WR1 upside markers, there is no consolation prize to fall back on.
Who To Draft: Archetypes First, Then Names
Everything above compresses into a small set of rules that we can apply directly to 2026 players.
The Archetypes
Draft early, with confidence: Round 1 rookie receivers, for redraft and dynasty both. The floor is real (70% ever startable), the volume arrives immediately (55.8% are fed as rookies), and within Round 1 do not pay a premium for the top-10 version if the price is steep, because earlier picks buy floor, not ceiling.
Draft on a timer: Day 2 receivers. A one-in-three career hit rate, but the value spikes in year two. Redraft: late-round flier only. Dynasty: target them in startup and rookie drafts, and buy low after quiet rookie years.
The only late dart worth throwing: Early half of Day 3, draft age 22 or younger, ideally with a genuine vacancy at the destination. That cell hits startable (WR3 season) at 20.5%, essentially Day 2 odds at a Day 3 price. Every step away from that profile (later picks, older prospects, crowded rooms) collapses toward 3%.
The profile to avoid entirely: Day 3, age 23 or older, late picks, full depth charts. The 24-plus cell is 0 for 22 all time in this study. Zero is a small-sample size zero, not a law, but you do not have to be the one who tests it.
The 2026 Round 1 Class
Five receivers went in Round 1 this past year: Carnell Tate to Tennessee at pick 4, Jordyn Tyson to New Orleans at 8, Makai Lemon to Philadelphia at 20 (the Eagles traded up for him), KC Concepcion to Cleveland at 24, and Omar Cooper Jr. to the Jets at 30.
The base rates say 44% (Think roughly 2-3 of the 5) of these will be startable this season, and the majority will clear 80 targets as rookies. Tate carries the best combination in the class: elite capital (a top-5 pick, where the floor is highest) at age 21, the youngest-age band, on a team that just cleared and rebuilt its receiving room around him. He is a legitimate redraft pick this year, not a stash. Tyson (22) brings the class’s biggest talent reputation and its biggest injury file; the study has no injury variable, so price that risk yourself, but the capital says startable soon. Lemon at 22 to Philadelphia is the interesting one: the capital is real but he enters a room with a decent alpha (DeVonta Smith), and Act Three’s residual says the second read on a good offense can be a fine living. Concepcion, at 21 the class’s other youngest-band receiver, lands in a Cleveland room with no entrenched alpha, however Denzel Boston is worth looking out for as he is standing out himself. Cooper at 30 to the Jets has the weakest capital of the five, and the training camp vibes are not great, not to mention Garrett Wilson is a clear alpha there, and pick 30 is where Round 1’s floor advantage starts fading toward Day 2 rates.
Redraft: With no injuries I would have said - Tate first, then Tyson and Concepcion, then Lemon, then Cooper. Considering injuries now, for Redraft I’d go – Tate, Concepcion, Lemon, Tyson, Cooper. Dynasty: The first order, Tate, Tyson, Concepcion, Lemon, Cooper, and all five are worth rostering, because 70.2% percent of receivers like them end up startable and 2-3 of those 5 will realistically end up WR1s.
The Honest Round 4 Conversation
Now the part where the data disagrees with people I like... The 2026 Day 3 rounds produced the names dynasty circles are excited about: Brenen Thompson, Elijah Sarratt, Kaden Wetjen, Skyler Bell, Bryce Lance, Colbie Young, Malik Benson.
Here is the problem. Not one 2026 Round 4 receiver is 22 or younger. Thompson and Sarratt are 23. Wetjen, Bell, Lance, and Young are 24. The sweet-spot cell that makes early Day 3 picks interesting, early pick plus young age, is empty in this year’s fourth round. The 23-year-old early Day 3 cell hits at 7.4%, and the 24+ cell is the 0-for-22 group. The study does not care that I really like Bell and Lance. Priors this strong do not bend for our feelings: these are sub 8 percent tickets, and the 24 year olds are drawing from a pot that has never once paid out. If you hold them, hold them cheap, watch for a vacancy to open ahead of them (that is the one event that historically changes the math), and do not add at cost. Where are the vacancies? I’ll point out Malik Benson, walking into a Raiders WR room that has no clear alpha, and is a total fresh start. He’s a late Day 3 23+ year old though, so just note historically his chances are 3.3% having an 80+ target season, and 3.3% he’d ever be a WR3.
The Real Darts: Two Names (+ a Bonus One) for the Nacua Chasers
Everyone wants to find the next Puka Nacua, so let’s be precise about what Nacua actually was: an early half of Day 3 pick (Round 5), draft age 22, who walked into a genuine target vacuum. That is the sweet-spot cell plus the vacancy rule stacked together. In 2026, exactly two rookies fit the profile.
Kevin Coleman Jr., Round 5, pick 177, Miami, age 22. The landing spot is the story. Miami released Tyreek Hill and traded Jaylen Waddle, vacating 53.0% of its 2025 target share, the largest vacancy in football. Coleman is a polished slot receiver with 271 college targets and famously reliable hands. This could actually point to a season where he breaks through. The honest concerns: pick 177 sits at the boundary of the early-Day 3 sweet spot rather than comfortably inside it, and Miami spread its bets, drafting two more receivers ahead of him in Round 3. He is a dart, not a favorite. But he is a dart aimed at the one signal in this entire study that triples first-feed odds. Dynasty: a priority late rookie pick or free pickup. Redraft: undrafted watch list, and a first-week waiver name if the vacancy starts flowing his way.
Reggie Virgil, Round 5, pick 143, Arizona, age 22. The profile is the story. Pick 143 is squarely in the early half of Day 3, he is 22, and he brings a 6-foot-3 frame with a 36-inch vertical, which matters not at all to the model (Act Four killed athletic testing) but does no harm. The counterweight is the room: Arizona’s vacancy is a modest 20.9% and Marvin Harrison Jr. and Michael Wilson are both solid receivers, so Virgil’s path runs through the WR3 job and/or an injury or departure above him. Dynasty: exactly the kind of 20.5% ticket the study says to buy with your last rookie picks. Redraft: not draftable yet, but keep an eye on him if there are any injuries.
If you force me to pick one, Coleman has the mechanism and Virgil has the profile. History says take the mechanism, then the profile, and take both before any 24 year old with a better highlight reel. If you go past the data, I actually like Virgil better as a dynasty stash, but that is only because I am concerned about the other two drafted receivers ahead of Coleman in Miami. If they weren’t there though, I’d go Coleman.
One that doesn’t fit the profile though, and is getting more interesting every day: Cyrus Allen, Round 5, pick 176, Age 23 (young 23). Though he doesn’t fit the exact Nacua archetype, mainly because of his age, there is a genuine target vacancy opening ahead of him and it is worth talking about. Let’s look past all the preseason hype, and there is a lot of it, and consider the actual situation. He is a first half of Day 3 pick and is a young 23, he turned 23 in February of 2026. That combination actually has decent odds, similar to late Day 3 and 22 or younger. As a reminder, 14.7% of those players ever had an 80+ target season and 7.4% percent had a fantasy WR3 season. More importantly, there is a MASSIVE vacancy opening up in front of him. The current depth chart has Kansas City’s 3 starting receivers as Rashee Rice, Xavier Worthy, and Tyquan Thornton. Today, on August 18th as I finish this article, Thornton suffered a hamstring injury, a tricky one that often lingers for wide receivers. There are two scenarios here: 1) Thornton comes back fast, however that gap of time still allows Allen to try and carve out a role. 2) Thornton’s injury lingers, and the opportunity to solidify a role as the WR3 on the Chiefs is right there and Allen’s for the taking. In addition to Thornton, you have Rice and Worthy that are both battling lingering injuries of their own. Rice, despite the knee issues, seems poised to have a healthy season, as of now. Worthy is battling a shoulder injury. The opportunity is wide open there for Cyrus Allen, so keep an eye on him. The hype is worth it, not because of the preseason vibes, but because of the concrete opportunity he has in front of him. Snag him late in drafts if the price hasn’t already gotten too high and if the other Chief’s wide receivers stay hurt, reach for him in dynasty and consider him for your redraft teams.
Veterans the Rules Point At, Both Directions
Applying the acquisition rule and the QB rule to two 2026 situations, beyond the case-study trio:
Buy signals. Michael Pittman, into Pittsburgh’s vacancy with 111 targets of role history behind him: a very clean veteran landing-spot worth going after. Alec Pierce with the Colts is also sitting nicely in the room that Pittman just left, and his QB is the same, the only concern there is his injury. Any young receiver already on the Pittsburgh or Miami rosters has a vacancy to capitalize on, so those are the rooms to scan on waivers and in dynasty free agency, because first-feed odds in those buildings roughly tripled.
Caution signals. Every fringe role-holder (80 to 99 targets) who changed teams this offseason carries the one-in-three retention number, whatever his new contract says; Doubs is the poster case, and he is not alone on the movers list. And every established receiver whose quarterback departed this offseason carries the halved retention odds. Check your dynasty roster against the QB carousel before you pay startup prices. Stefon Diggs also feels exciting in Washington, but temper your expectations. With 102 targets last year he had a mid-range role in New England, which means he only has a slightly over 50% chance to get 80+ targets this year on his new team. Consider him only with caution in both dynasty and redraft.
What It Means For Your Fantasy Draft
Redraft 2026. Draft Round 1 rookie receivers as immediate starters; Carnell Tate belongs in your lineup plans, not your bench. Treat Day 2 rookies as late fliers and Day 3 rookies as free waiver names. Fade fringe-volume veterans on new teams at their name brand price, Doubs first among them, and be cautious with any established receiver who just lost his quarterback. Chase volume over talent every single time, because the players are equal per target while the targets are not equal per player.
Dynasty 2026. Pay up for Round 1 rookie capital; it is the only thing in this study that buys a floor. Buy Day 2 receivers before their second season, especially after quiet rookie years. Spend your last rookie picks only on the sweet-spot cell, and this year that means Kevin Coleman Jr. and Reggie Virgil, and maybe Cyrus Allen. Audit your roster every March for two events: a vacancy opening ahead of your young receivers (hold harder) and a quarterback departing from under your established ones (sell sooner). And after year two with no startable season, cut bait. Three percent is the number for Day 3, and hope is not a viable strategy.
The Model, Briefly
Alongside this study, I created a 2026 wide receiver ranking model, the same one that powers the WR Lab on our (coming soon) data dashboard.
It is a ridge regression (a regression that deliberately shrinks its own coefficients to avoid overfitting) trained on 1,352 receiver seasons from 2016 through 2025, validated walk-forward, meaning every season is predicted using only information from before it. Its inputs are the things this study found to matter: target share, air-yards share, team pass volume, age, per-target efficiency, and, new as of late, two team-change features built from prior-season data, the target share vacated at a receiver’s destination and the competition added around him. Those two features impact the model exactly as the article says they should. They barely move rankings for the roughly 100 receivers who stay put, and they meaningfully improve rankings for the roughly 30 who move each year. Rookies are added separately using the factors we considered as important for rookies and adjusted for dynasty and redraft. Though I don’t have the full rankings in here, the model was a driving force for the article and the rankings will be made available soon.
One thing to also clarify. Act Two found that per-target efficiency was flat across draft days. That finding is about groups, not individuals. Draft round does not predict how efficient a receiver is. His own prior efficiency does however, still help predict his next season, which is why the model uses it and why Act Four found that a standard deviation of yards per target buys about 0.44 targets per game the following year.
Methodology
Population: 580 WRs drafted 2008-2025 (nflverse draft data); headline analyses use the 481 from the 2008-2022 classes, with outcomes through 2025. 5 players from Day 3 of draft in entire study did not have verifiable ages in dataset, therefore they were excluded from age calculations and statistics.
Fantasy outcome: best seasonal PPR finish among all WRs (ranked against the full WR pool each season, regular season only). “Startable” means top-36; WR1 means top-12. Feeds: 80 or more targets in a regular season.
Snap layer: nflverse participation data, 2016-2025; pass snaps defined as dropbacks (validated against attempts plus sacks at a 0.973 median ratio); snap share is player dropbacks over team dropbacks.
Efficiency panel: 15 per-target metrics, Holm-corrected pairwise tests by draft day at the 150-career-target bar. Pre-draft signals: nine athletic metrics (combine), six college-production signals (CollegeFootballData play-by-play, matched by name and school with manual verification of every fuzzy match), level of competition, five landing-spot specifications, return usage, and rookie QB change, all tested with draft position controlled and Benjamini-Hochberg corrected within families.
Vacancy panel: 805 at-risk player-seasons, with leading-receiver departure identified by roster reconstruction and a cluster bootstrap by player.
Era analysis: mature classes (seven or more seasons), boundary-free trend tests alongside era splits.
Movers analysis: 2016-2025 adjacent season pairs, primary team defined as the team with the most targets that season; Fisher exact tests plus logistic controls for prior targets, prior finish, and estimated age.
Rookie calendar: rookie rates on the 2016-2025 classes, career timing on the 2016-2022 classes.
The 2026 model: a walk-forward-validated ridge regression on 1,352 player-seasons, 2016-2025, with vacancy and added-competition features. All 2026 player teams, draft slots, and transactions named in this article were verified against current reporting in August 2026. The key structural findings (the draft universe, both gates, the snap gate, the age gradient’s 24-plus cell, the 2013-2019 era arm, and per-target flatness) were independently re-derived from raw data, in a separate language and environment from the original study, while the writing of this article.
Appendix: Data Science Terms
p-value. The probability of seeing a result at least this extreme by pure chance if no real effect existed. Smaller is stronger evidence; 0.05 is the conventional line, and the headline findings here sit far below it.
Odds ratio (OR). The multiplier on a player’s odds per unit change in an input. An OR of 2.79 means the odds nearly triple; an OR of 0.99 means nothing is happening.
Holm and Benjamini-Hochberg corrections. Adjustments that raise the evidence bar when you run many tests at once, so that testing fifteen metrics does not hand you a fake discovery for free.
Likelihood ratio test (LRT). Asks whether a more complicated model earns its complexity. Here it is how I showed that round boundaries add nothing over a smooth curve.
Target share and air-yards share. A receiver’s fraction of his team’s targets, and of its intended downfield yardage.
Dominator rating. A college receiver’s share of his team’s receiving production.
Snap share (pass snaps). The fraction of team dropbacks a receiver was on the field for. Not the same as routes run, which is proprietary charting data.
Ridge regression. A regression that shrinks its coefficients on purpose, trading a little bias for a lot of stability; standard for prediction with correlated inputs.
Walk-forward validation. Testing a model only on seasons after its training data, so it is never graded on information it could not have had.
Cluster bootstrap. Resampling by player rather than by season, so one player’s many seasons cannot masquerade as independent evidence.
Censoring. When outcomes have not finished happening yet; young classes’ career rates can still rise.
Vacated share and added competition. The prior-season target share of players who left a team, and of players who arrived (with rookies counted at their draft round’s historical expectation). Built only from prior-season data so the model never peeks at the future.
At-risk player-season. A season entering which a receiver has never yet had an 80-target season.
Fed / feed. Reaching 80 targets in a season. The toll booth.
Data: nflverse (draft, stats, rosters, participation), CollegeFootballData. nflreadr
Explore The Lab.


Recent Lab Articles.
Read more
NFL BUZZ - OCTOBER 18th RAPID FIRE
Your daily NFL news and fantasy football report. Injuries, usage trends, roster moves, breaking news and more, all in one place. Keep up with NFL Buzz and you’ll never miss a beat.
NFL BUZZ - OCTOBER 17th RAPID FIRE
Your daily NFL news and fantasy football report. Injuries, usage trends, roster moves, breaking news and more, all in one place. Keep up with NFL Buzz and you’ll never miss a beat.

Navigating the Week 6 Injury Hayes
Wading Through the Murky Injury Waters to Provide a Roadmap for Handling Your Team's Injury Situations
NFL BUZZ - OCTOBER 16th RAPID FIRE
Your daily NFL news and fantasy football report. Injuries, usage trends, roster moves, breaking news and more, all in one place. Keep up with NFL Buzz and you’ll never miss a beat.